![]()
![]()
STATISTICS AND THE NEW GRAPHING CALCULATORS
Abel Martín Álvarez (Pérez de Ayala School, Oviedo-Asturias)
Jordi Baldrich Álvarez (Itaca School, Barcelona)
| Summary | Introduction | Contents | Objectives | Methodology | Problems | Evaluation | Final thoughts |
This document sets out the results of a classroom experiment we conducted with 15-17-year-olds with a view to assessing the various educational strategies that have arisen with the emergence of new technologies in the field of maths teaching. We will discuss the opportunity for developing new contents by modifying current teaching procedures and then suggest a new classroom organisation where “traditional” maths coexist with a more “innovative” approach, giving priority to the thinking process, decision making and application.
Our approach to maths teaching, especially with regard to statistics, needs a whole new set of goals, procedures and methods if we want to adjust to the impact of new technologies, among which the most important are the new calculator models because of their user-friendliness, small size, manageability and price, as is the case in all "developed" countries. The drawback is that research into new teaching methods using this new technology is progressing at a very slow pace.
This is the main reason behind our decision to carry out this "pilot" experiment in a secondary school, the IES of Pérez de Ayala of Oviedo in Spain, with students aged between 15 and 17 years old.

We will not embark on a detailed description of the contents of the "Two-dimensional Statistics" section, as they are all well-known and can be found in any textbook. We will only mention that these devices have helped us develop and further enhance the study of the Tukey line, when there are outliers, or non-linear regression.
We will deal in more detail with the two following sections -objectives and methodology- by suggesting modifications and new approaches, so that maths teaching can adapt to changing times
![]() To recognise a two-dimensional statistical variable and to distinguish
functional dependence from statistical dependence.
To recognise a two-dimensional statistical variable and to distinguish
functional dependence from statistical dependence.
![]() To learn how to represent and interpret a two-dimensional distribution by means
of a scatter diagram.
To learn how to represent and interpret a two-dimensional distribution by means
of a scatter diagram.
![]() To interpret a correlation as the measurement of a linear relationship between
two variables.
To interpret a correlation as the measurement of a linear relationship between
two variables.
![]() To recognise regression lines as the best adjustment to a scatter diagram.
To recognise regression lines as the best adjustment to a scatter diagram.
![]() To make critical predictions on the basis of a regression line, where possible.
To make critical predictions on the basis of a regression line, where possible.
![]() To facilitate problem solving by encouraging students to spend more time on the
initial analysis of the information presented and on taking decisions as to what
steps to take, and finally on verifying and critically analysing the results—the
true objective of any preparatory or university course.
To facilitate problem solving by encouraging students to spend more time on the
initial analysis of the information presented and on taking decisions as to what
steps to take, and finally on verifying and critically analysing the results—the
true objective of any preparatory or university course.
![]() To incorporate the element of motivation as a teaching strategy.
To incorporate the element of motivation as a teaching strategy.
![]() To provide alternative methods to solving problems and stimulating the students’
capacity to think.
To provide alternative methods to solving problems and stimulating the students’
capacity to think.
![]() To develop students’ ability to work autonomously as a result of being able to
check results and confirm predictions without the teacher’s constant
supervision.
To develop students’ ability to work autonomously as a result of being able to
check results and confirm predictions without the teacher’s constant
supervision.
![]() To encourage team work and debate.
To encourage team work and debate.
![]() To increase the level of participation and reflection in the classroom.
To increase the level of participation and reflection in the classroom.
![]() To ease, wherever possible, the burden of having to make numerous calculations
in order to be able to take a decision, which is usually the ultimate objective.
To ease, wherever possible, the burden of having to make numerous calculations
in order to be able to take a decision, which is usually the ultimate objective.
![]() To exercise and educate the mind so that students learn to automatically deal
with data, draw conclusions, take decisions...simply put—to think!
To exercise and educate the mind so that students learn to automatically deal
with data, draw conclusions, take decisions...simply put—to think!
![]() To broaden content in an effort to make the unit more "practical and
interdisciplinary", relating it at all times to our day-to-day world and to how
nature works, which often consists of non-linear relationships between
variables: exponential, logarithmic, logistical and potential regression, among
others.
To broaden content in an effort to make the unit more "practical and
interdisciplinary", relating it at all times to our day-to-day world and to how
nature works, which often consists of non-linear relationships between
variables: exponential, logarithmic, logistical and potential regression, among
others.
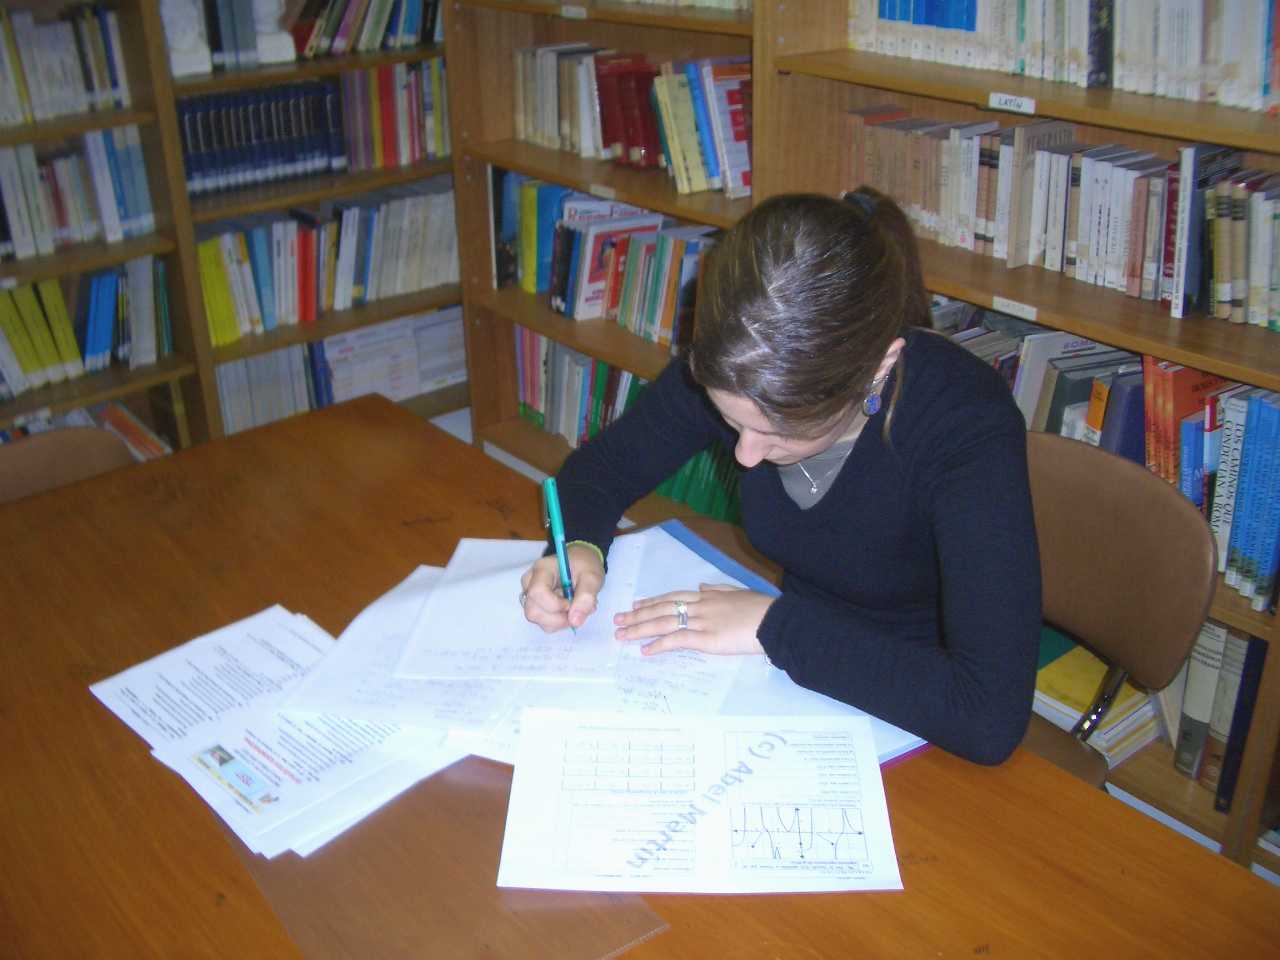
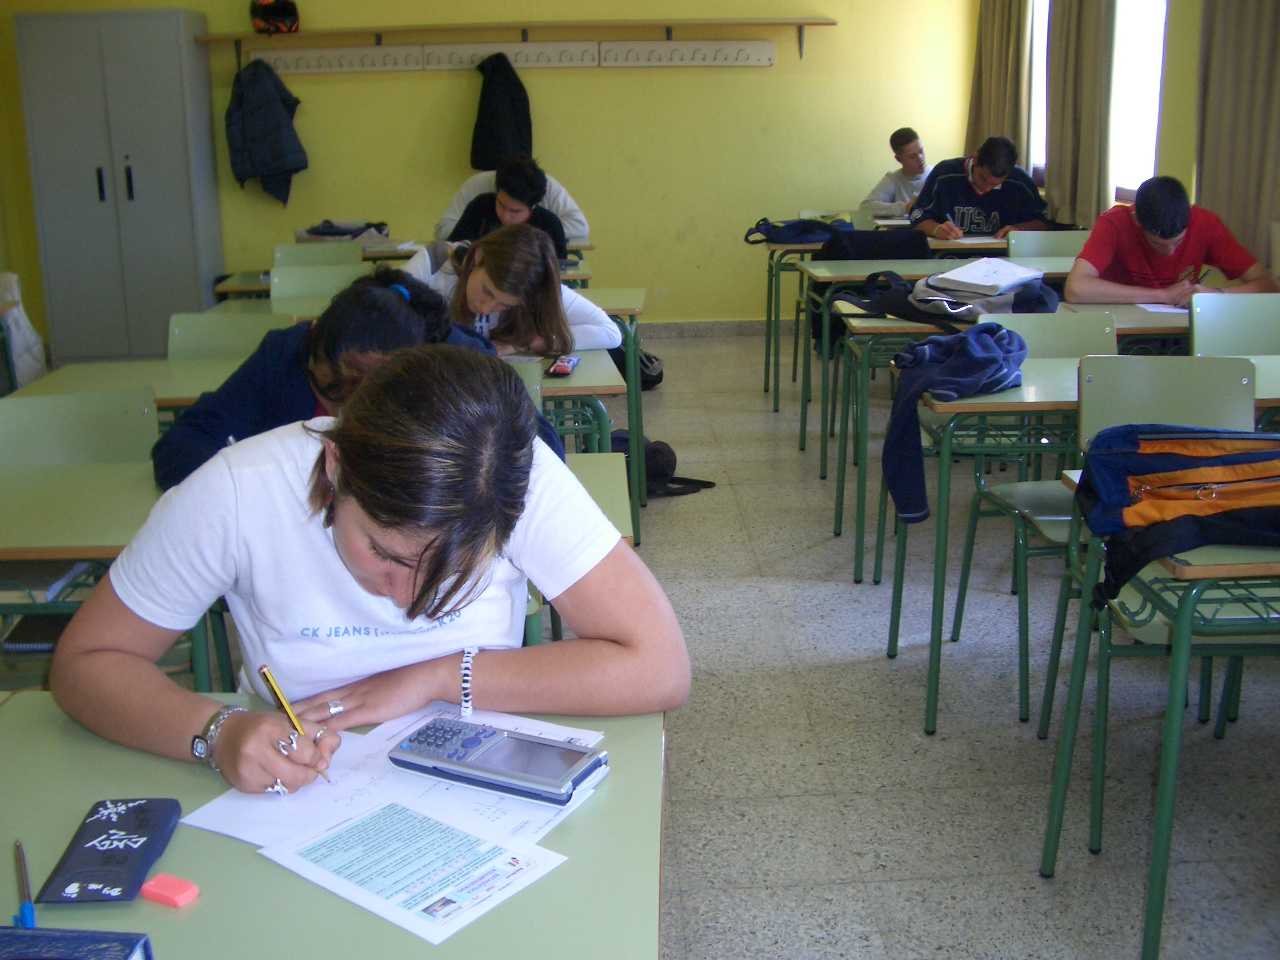
Both the theory and the practical lessons -the latter of which consist of solving and analysing problems- are taught in the classroom.
Students do not need to be taken to the computer room or any other special room at school.
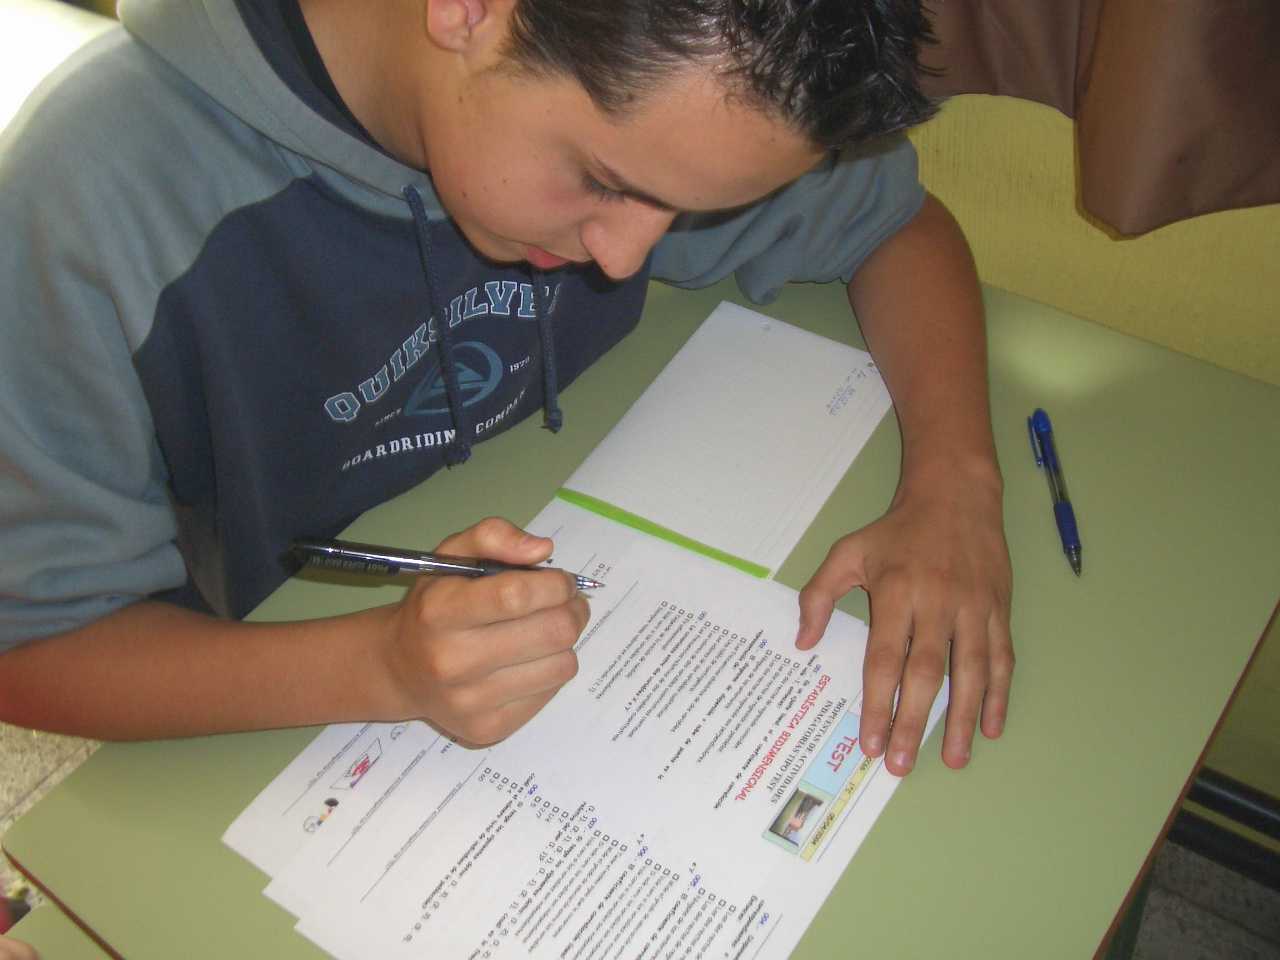
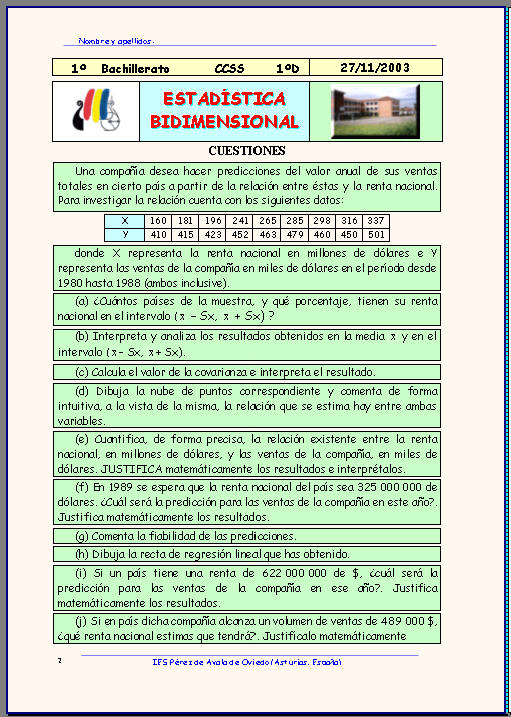
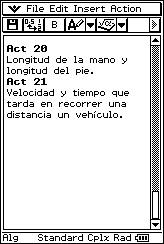
(a) Teachers start by explaining to their students that they are going to do an activity that involves studying aspects of their daily life, such as the following example:
- Can you find a relationship between the height of boys and their fathers? And between girls and their mothers? (Problem 1)
|
|
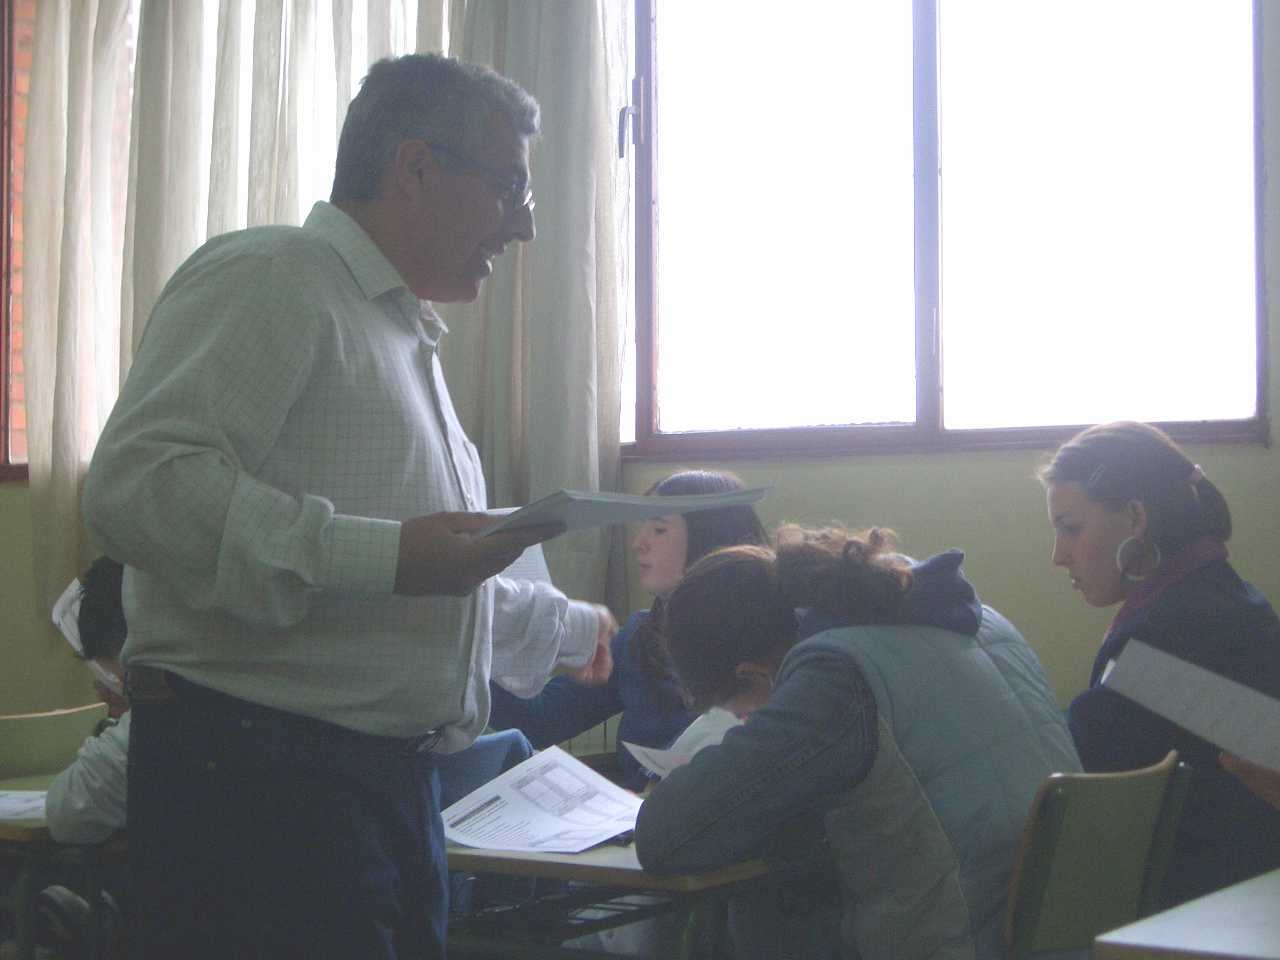
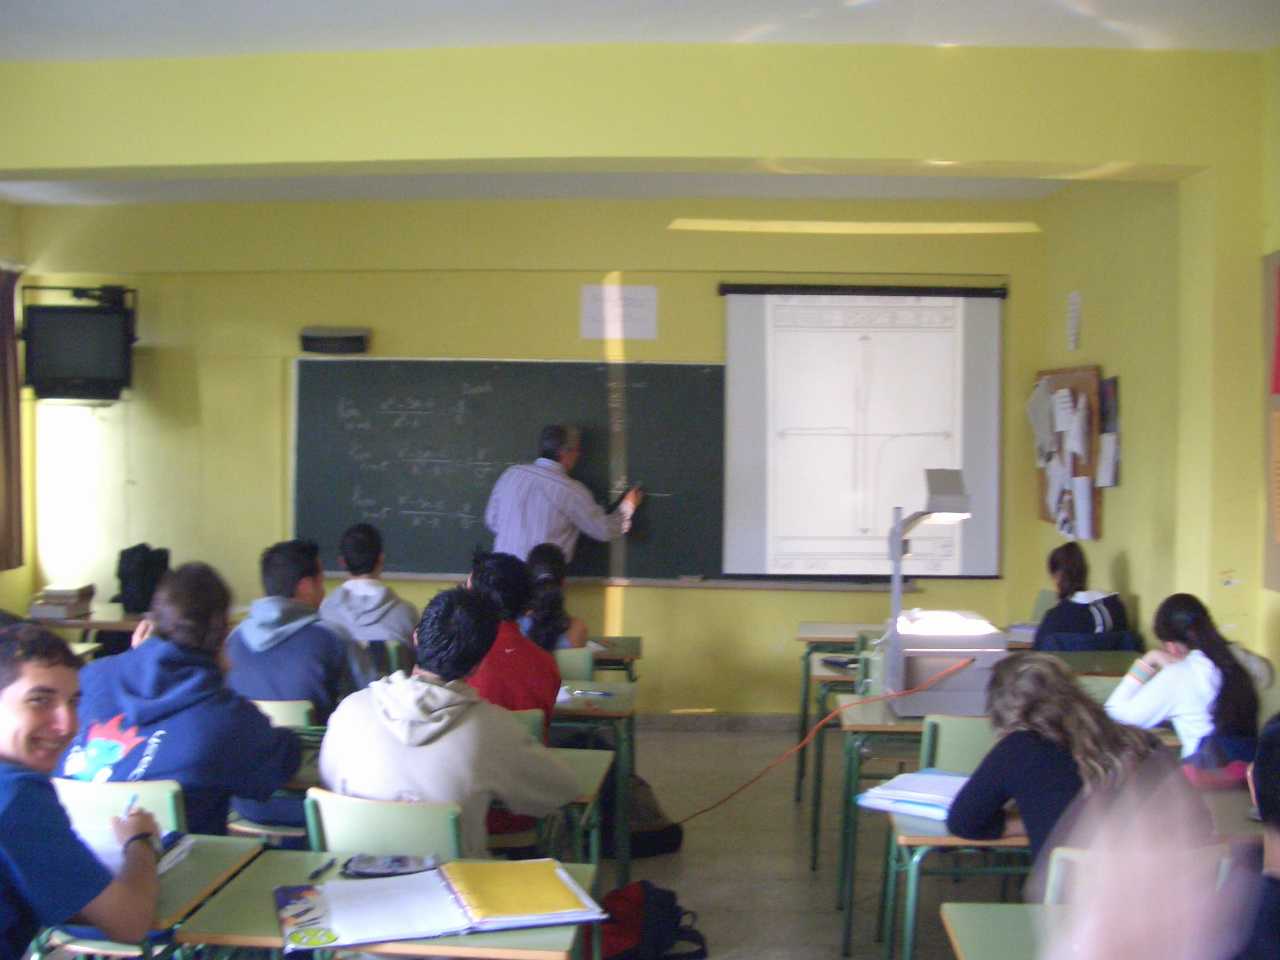
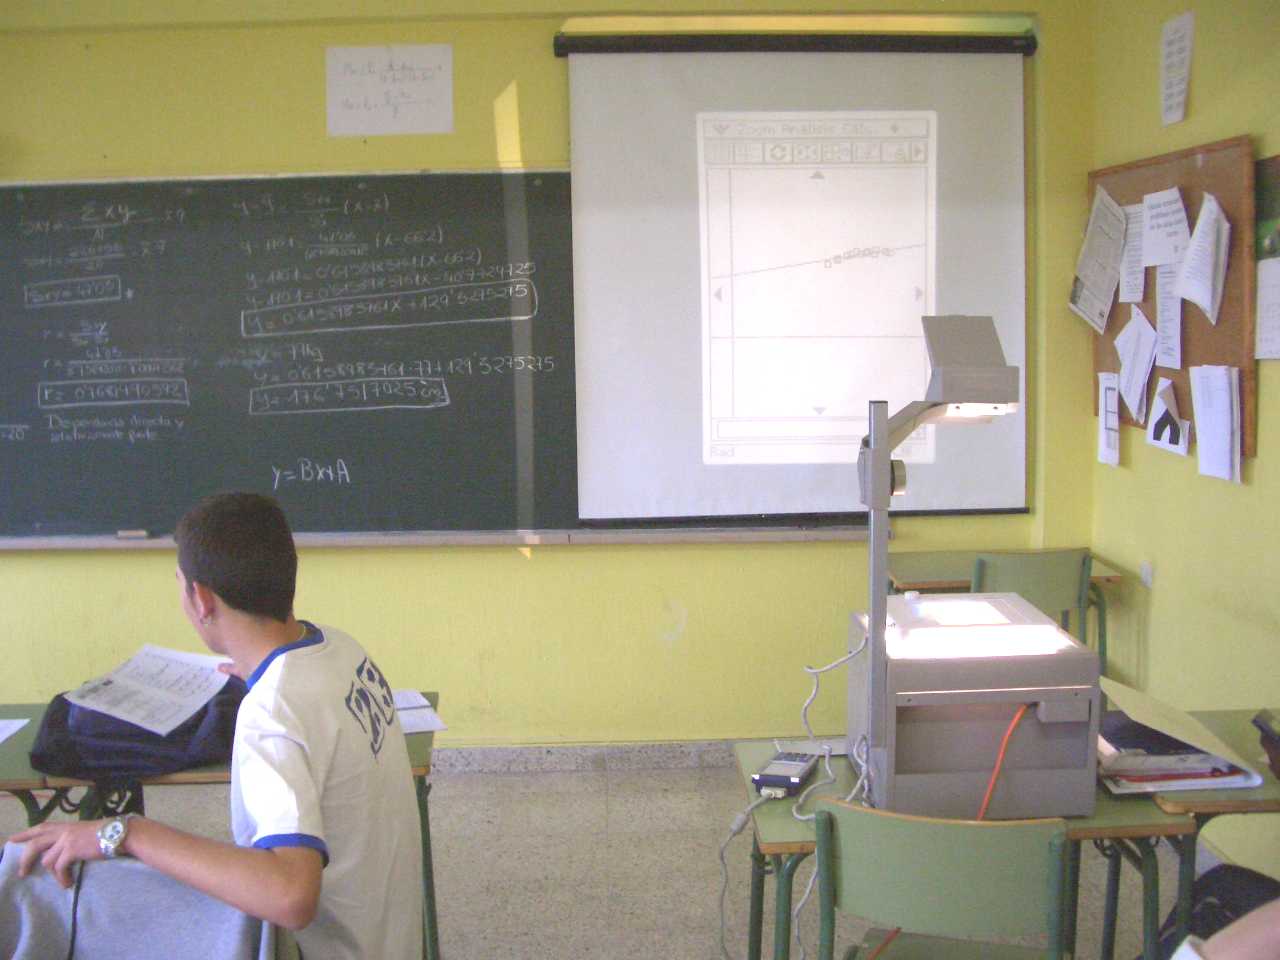
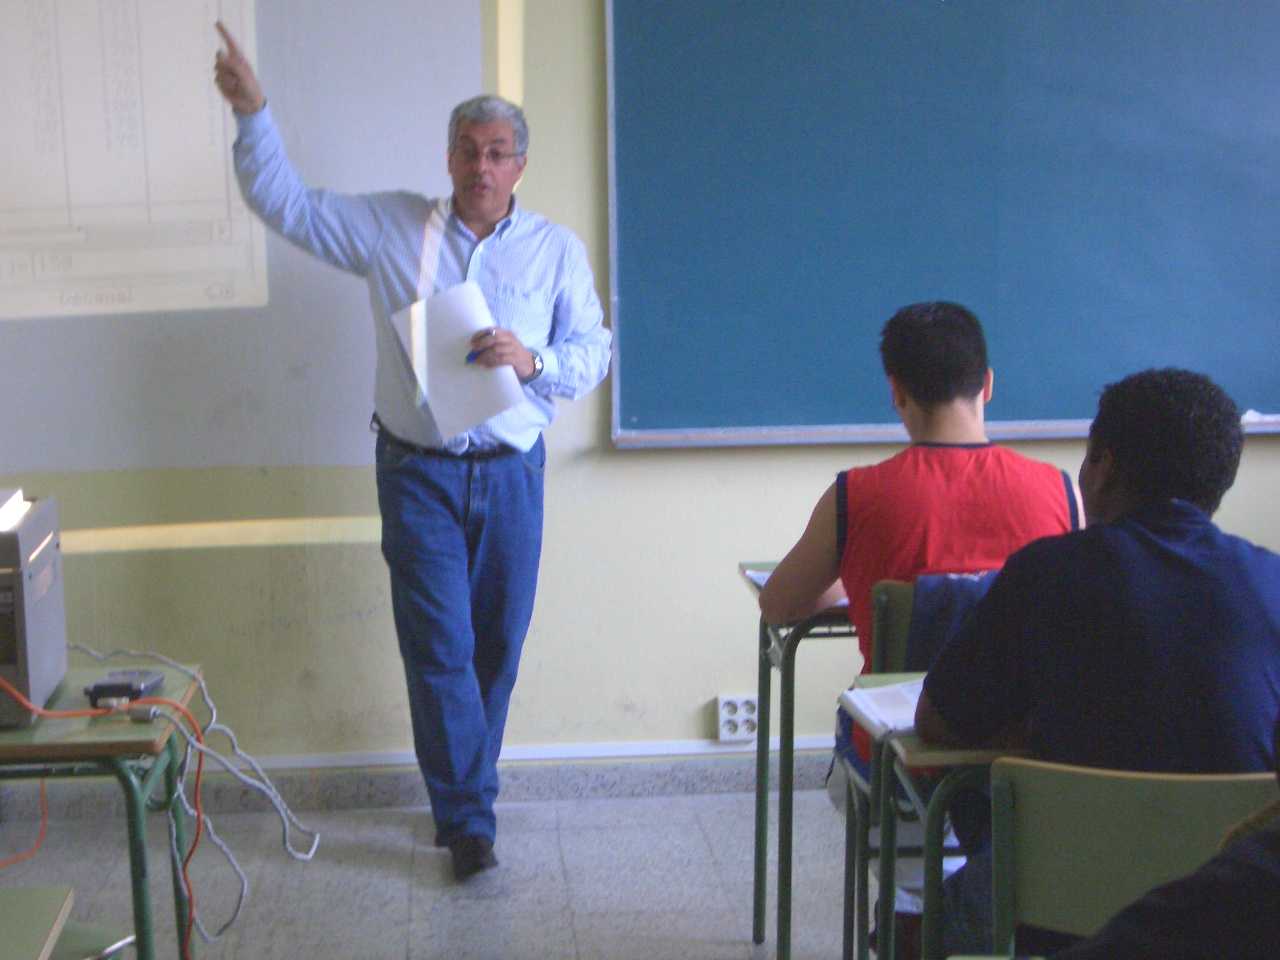
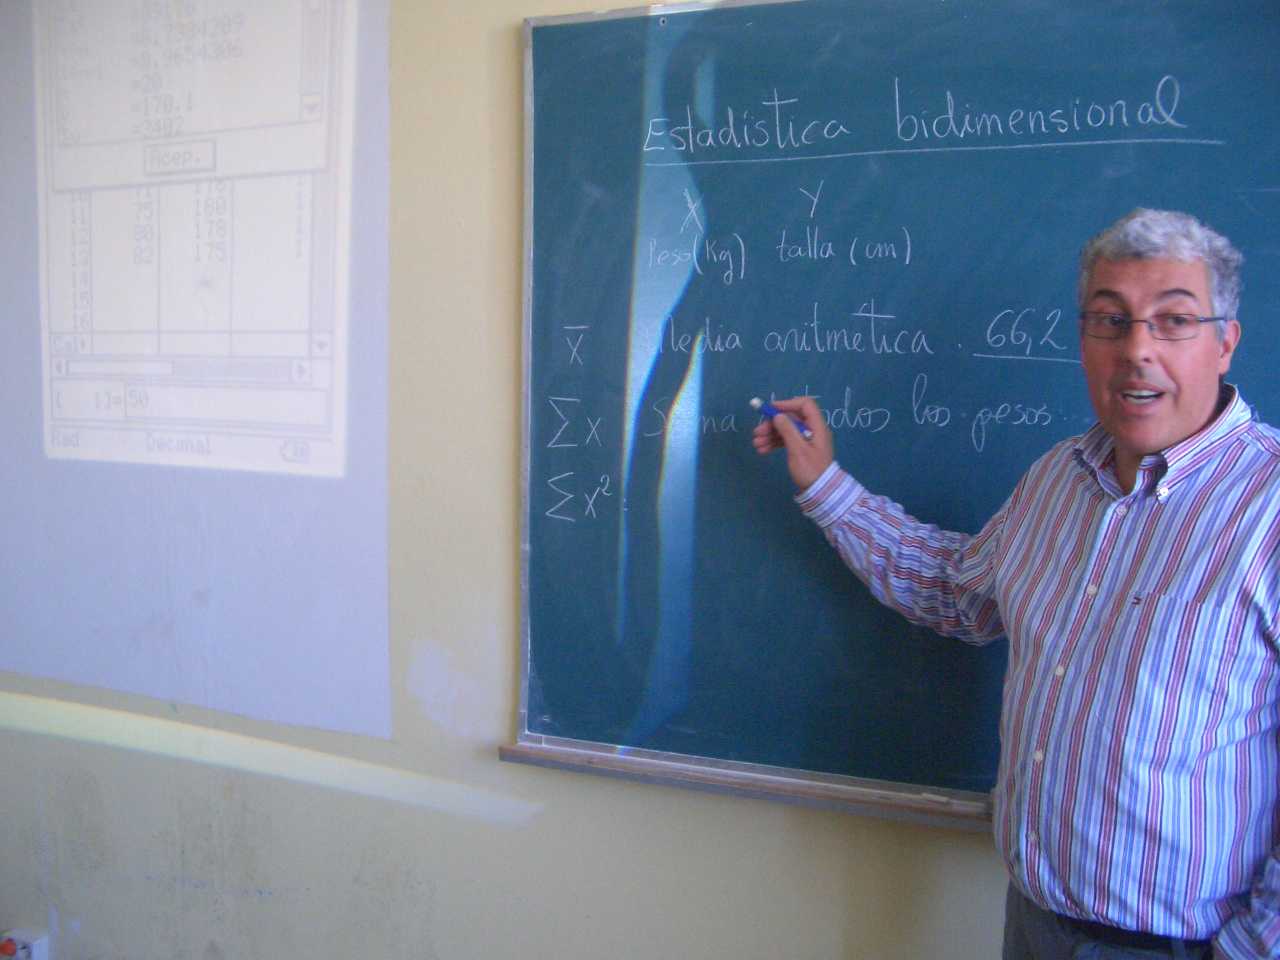
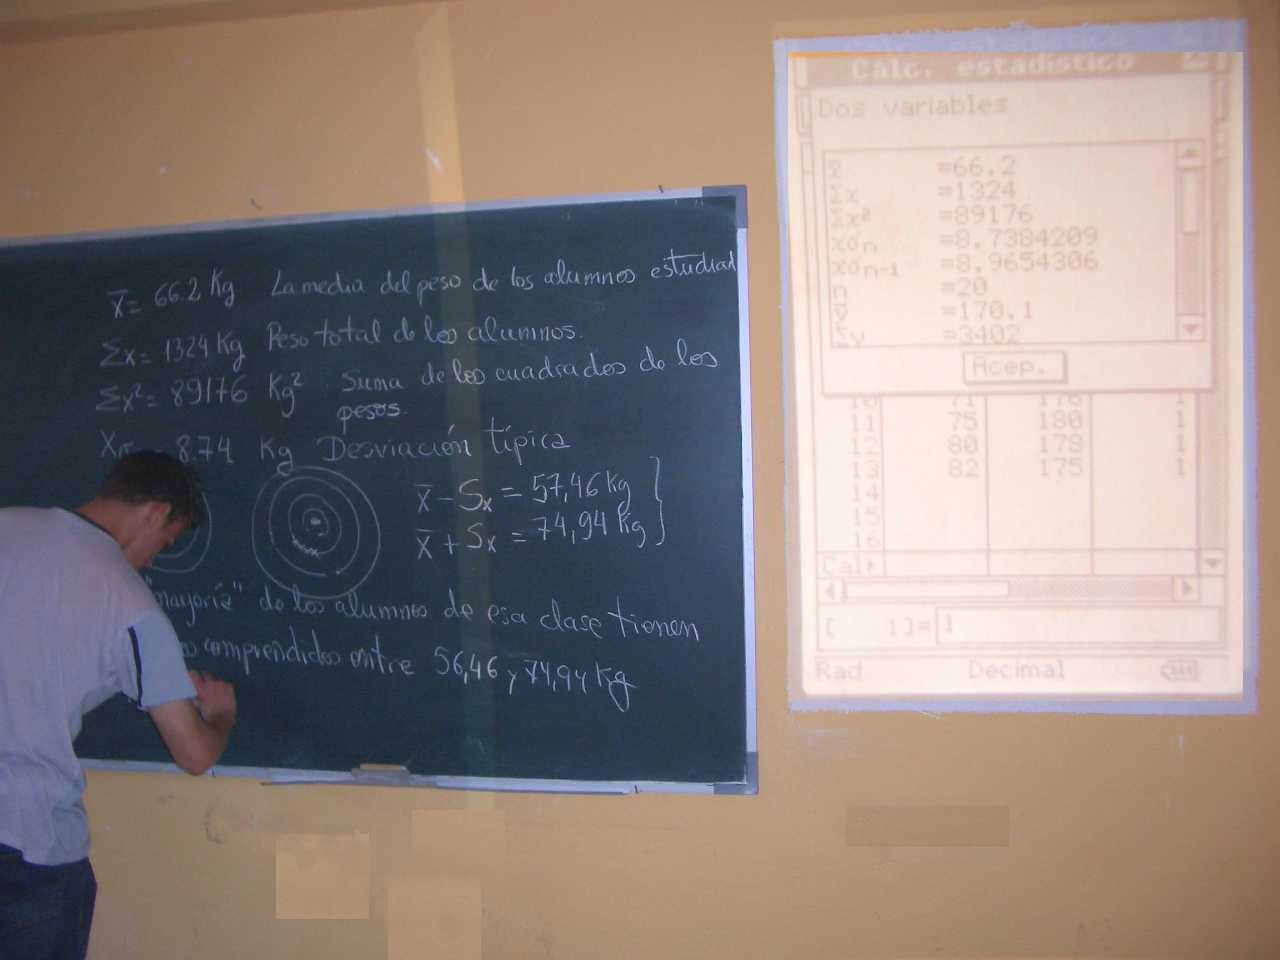
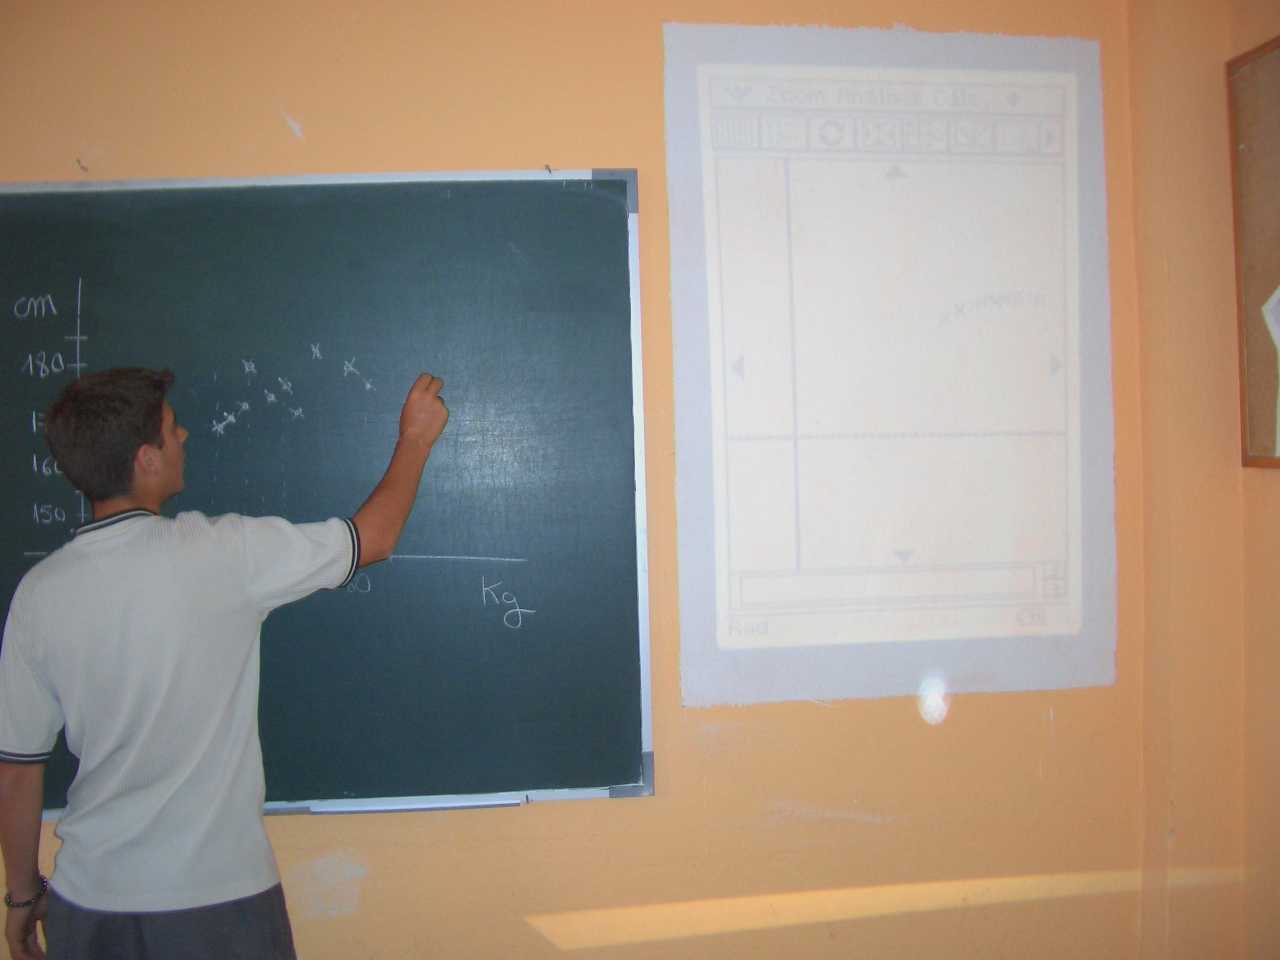
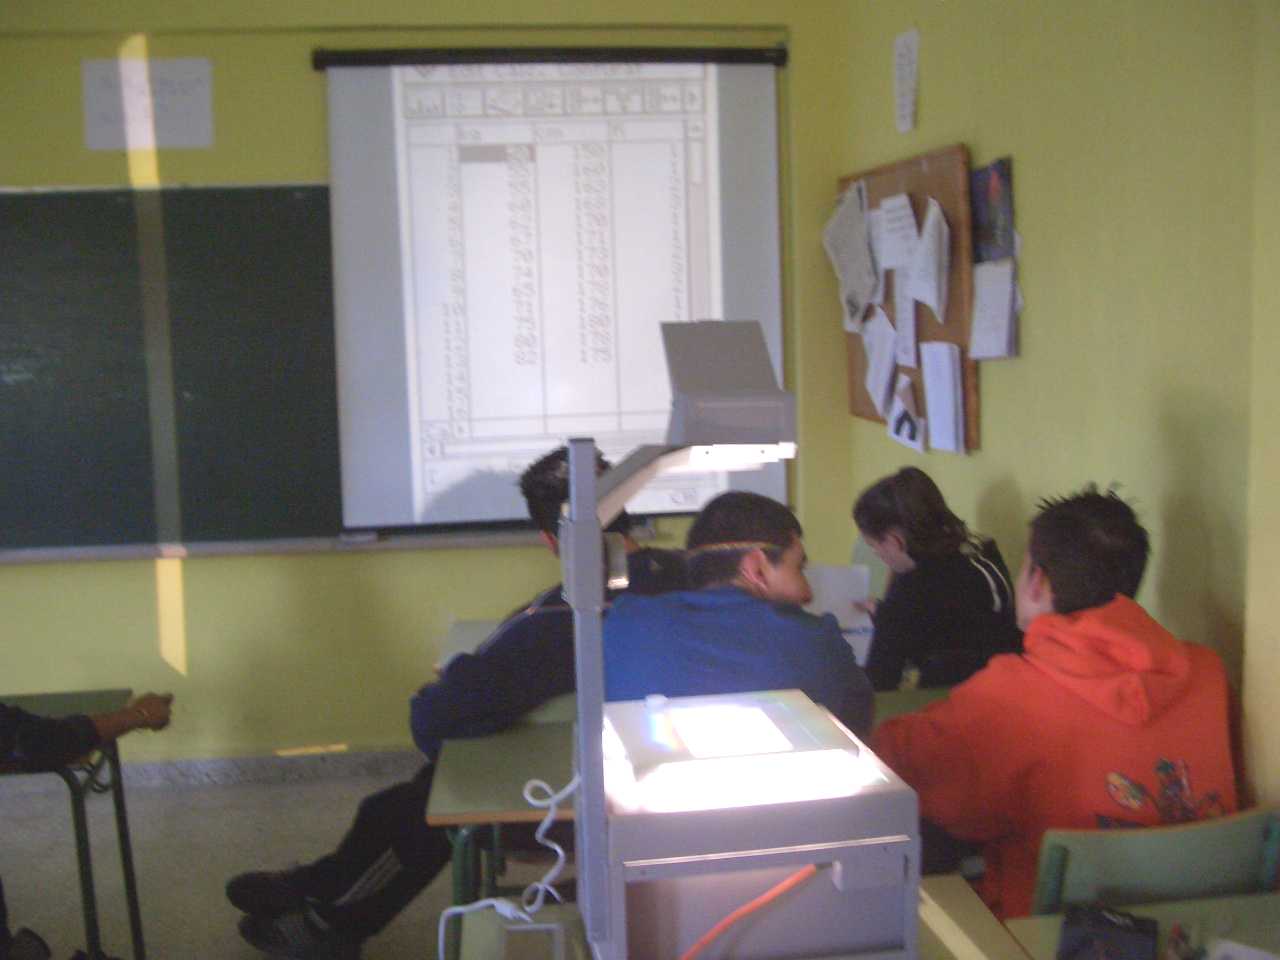
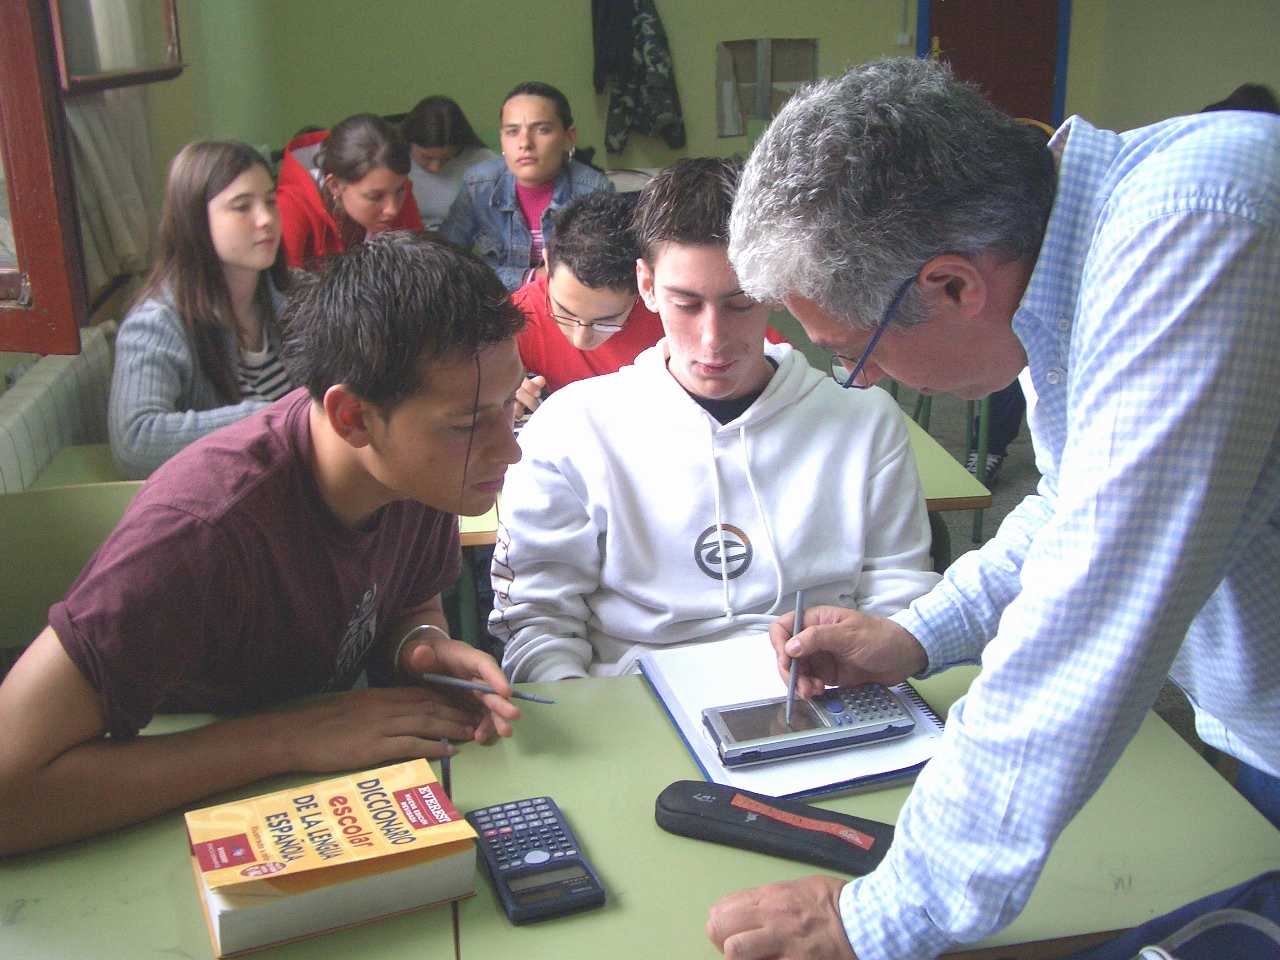
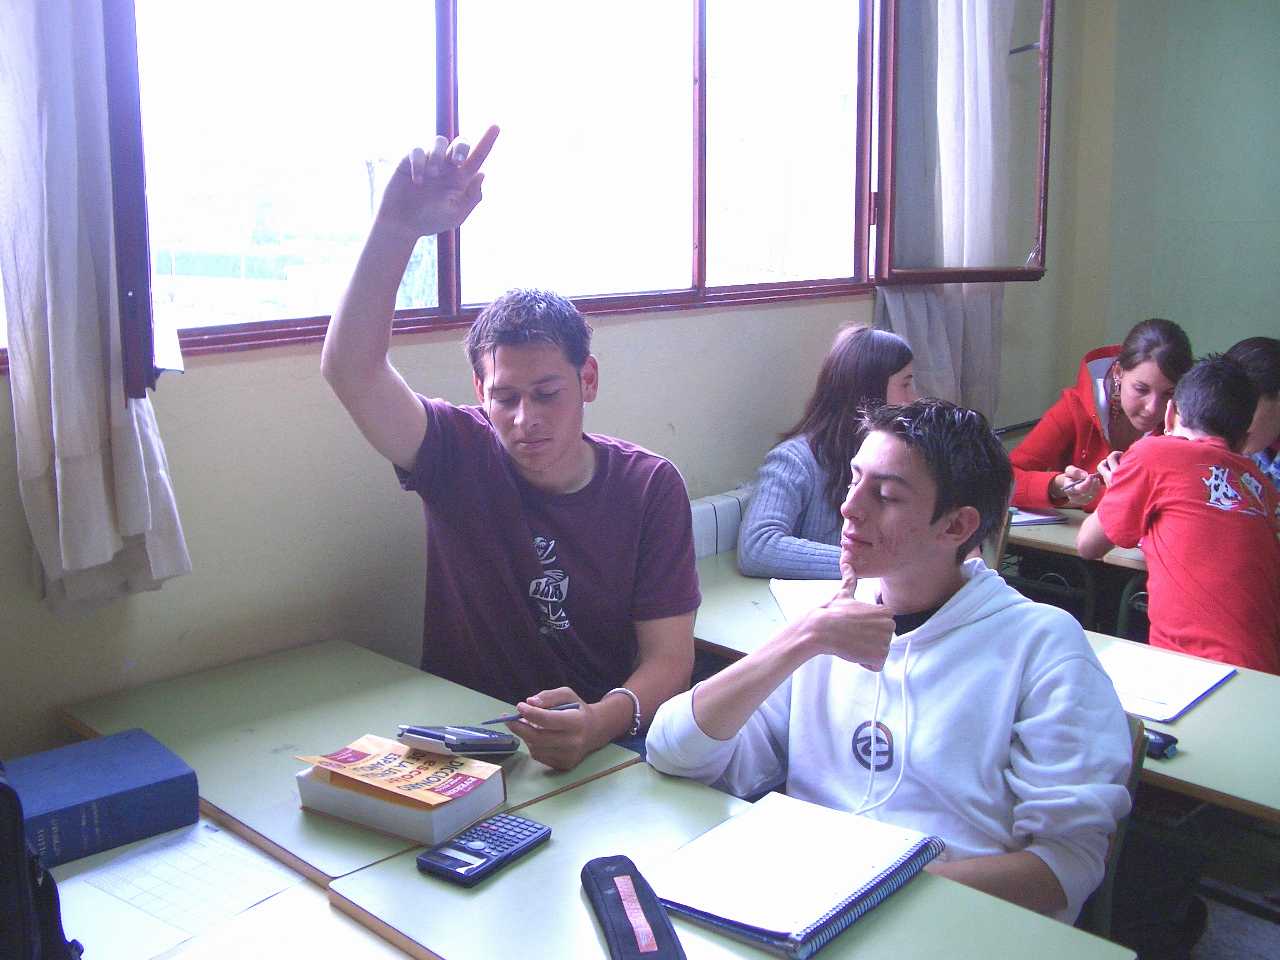
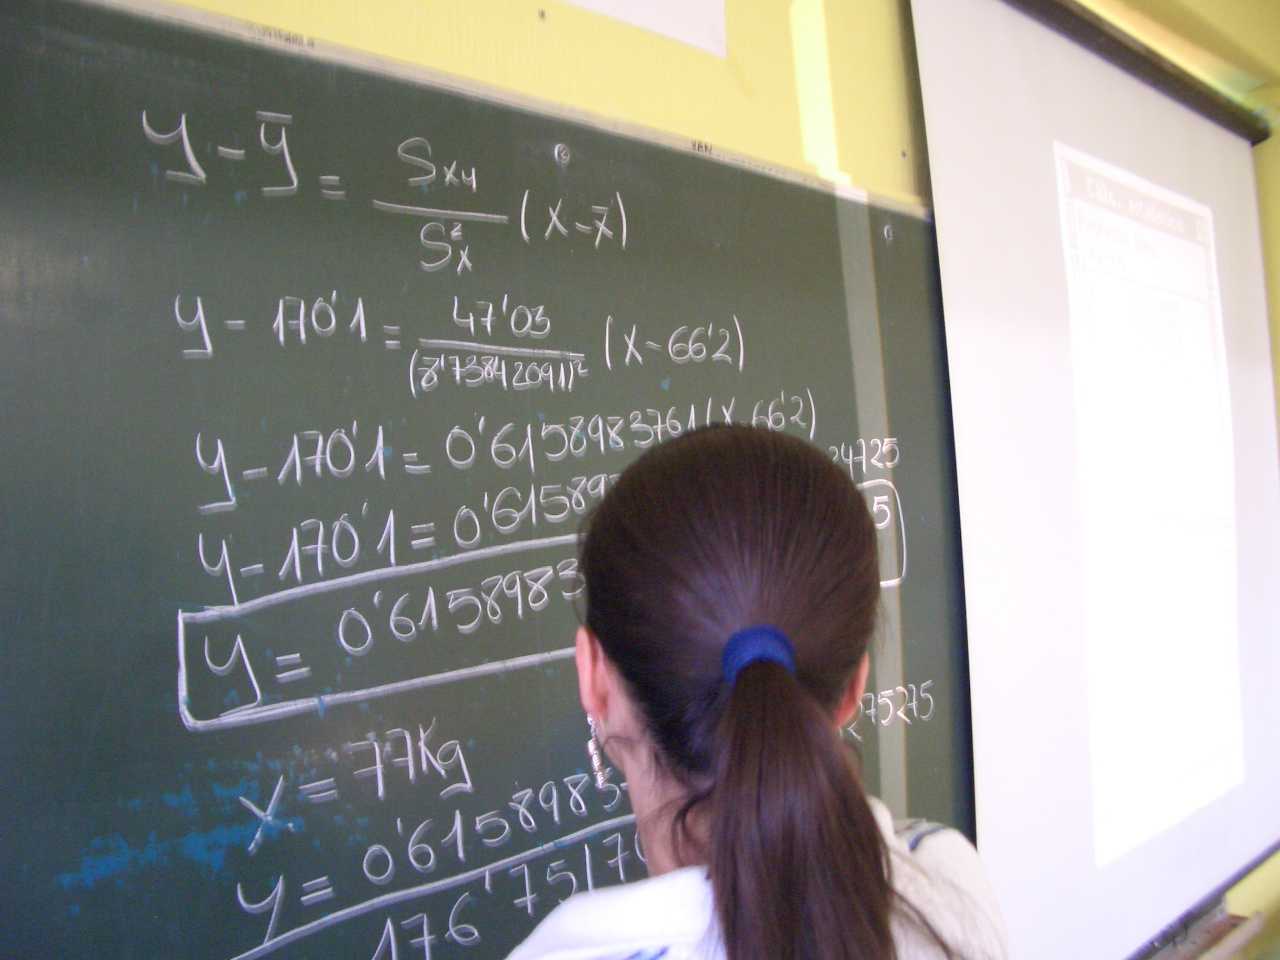
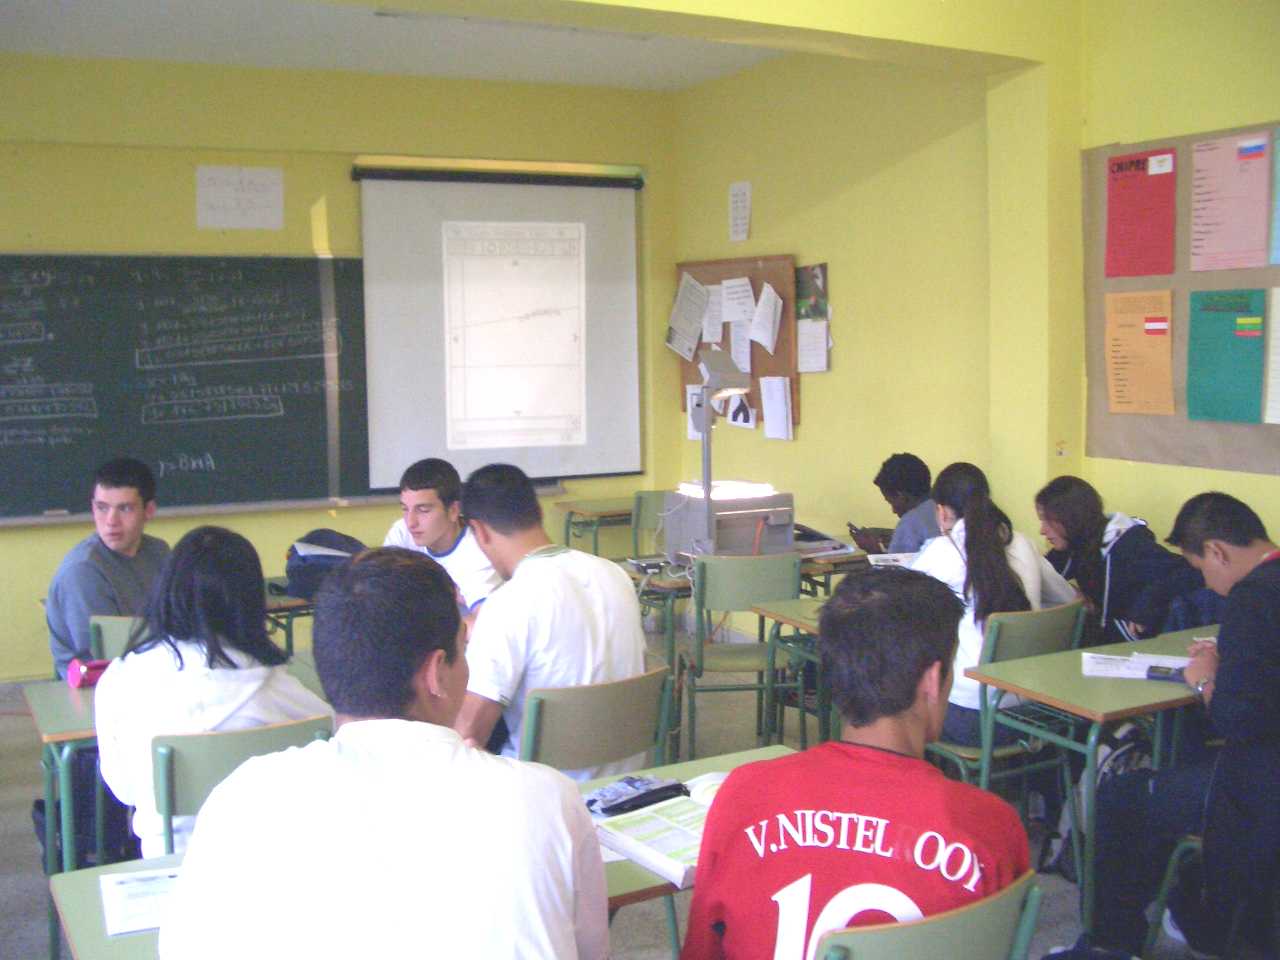
(b) Two different approaches are to be used simultaneously: the "traditional" approach involving the use of the blackboard (in order to explain and record those details considered relevant), and an "innovative" approach giving importance to the graphing calculator and projecting its screen in the classroom. Using these two approaches together gives the entire class a quick and precise overview of the problems.
|
|
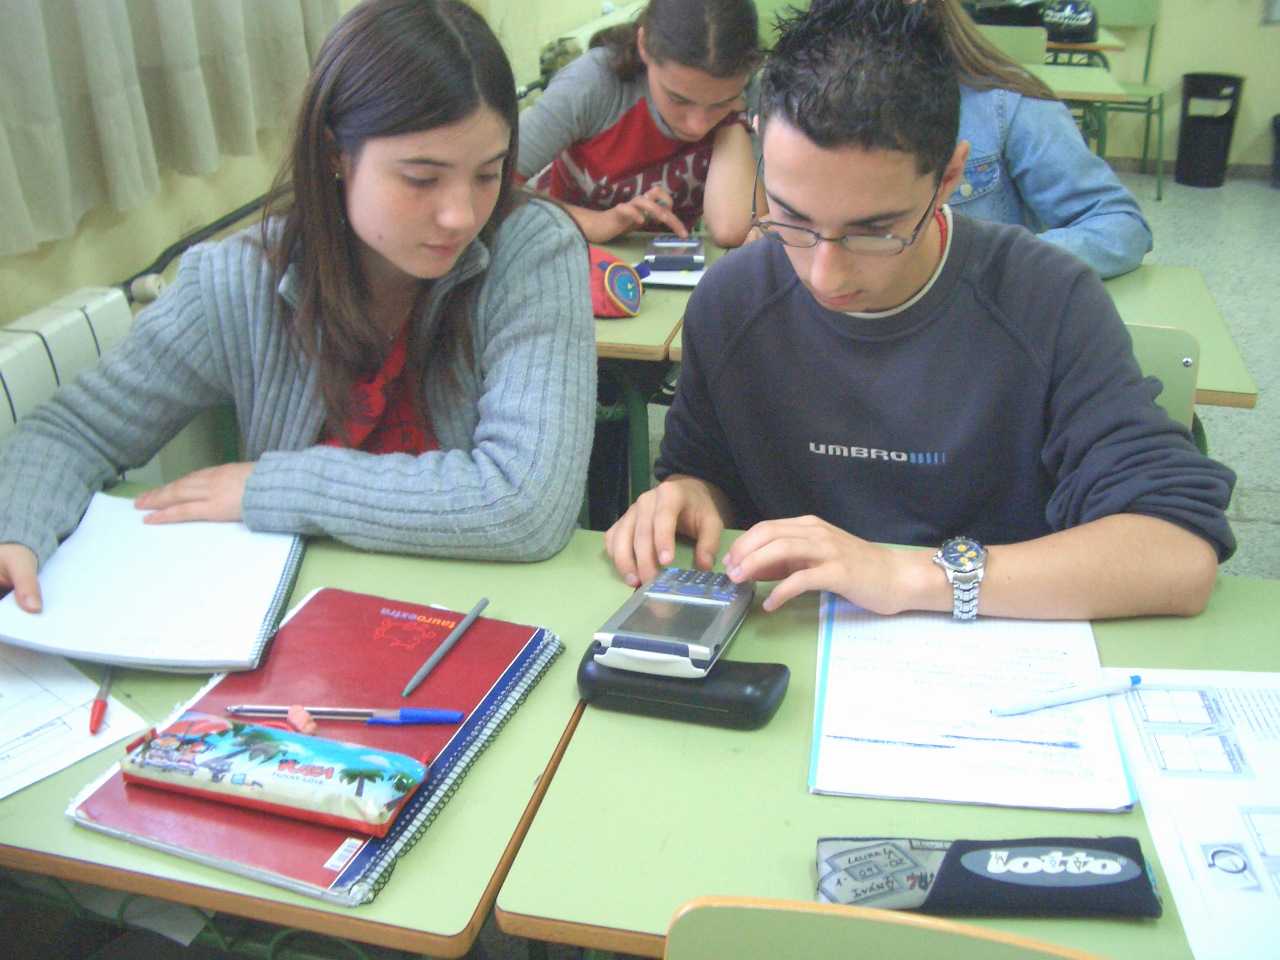
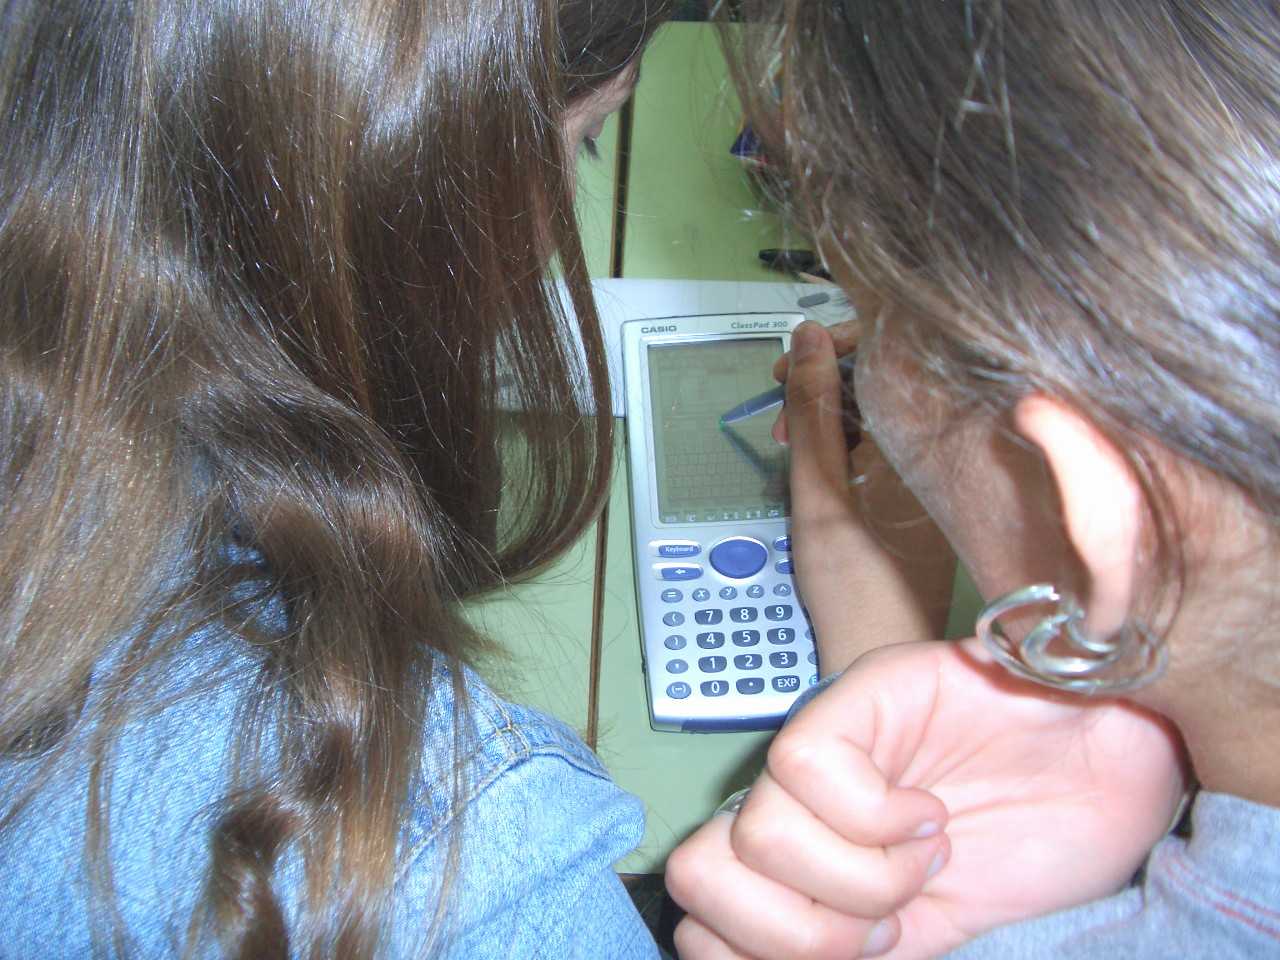
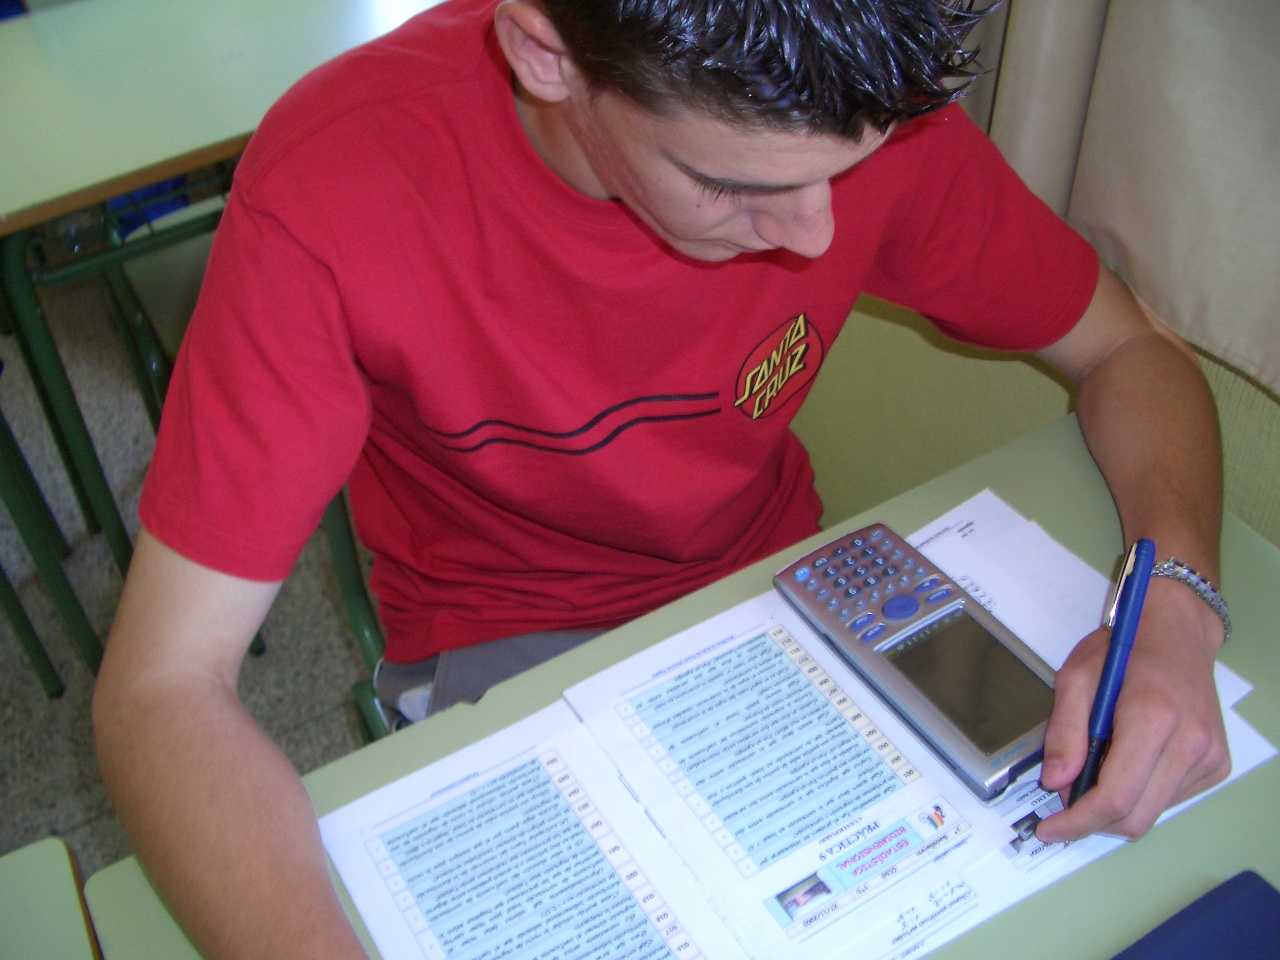
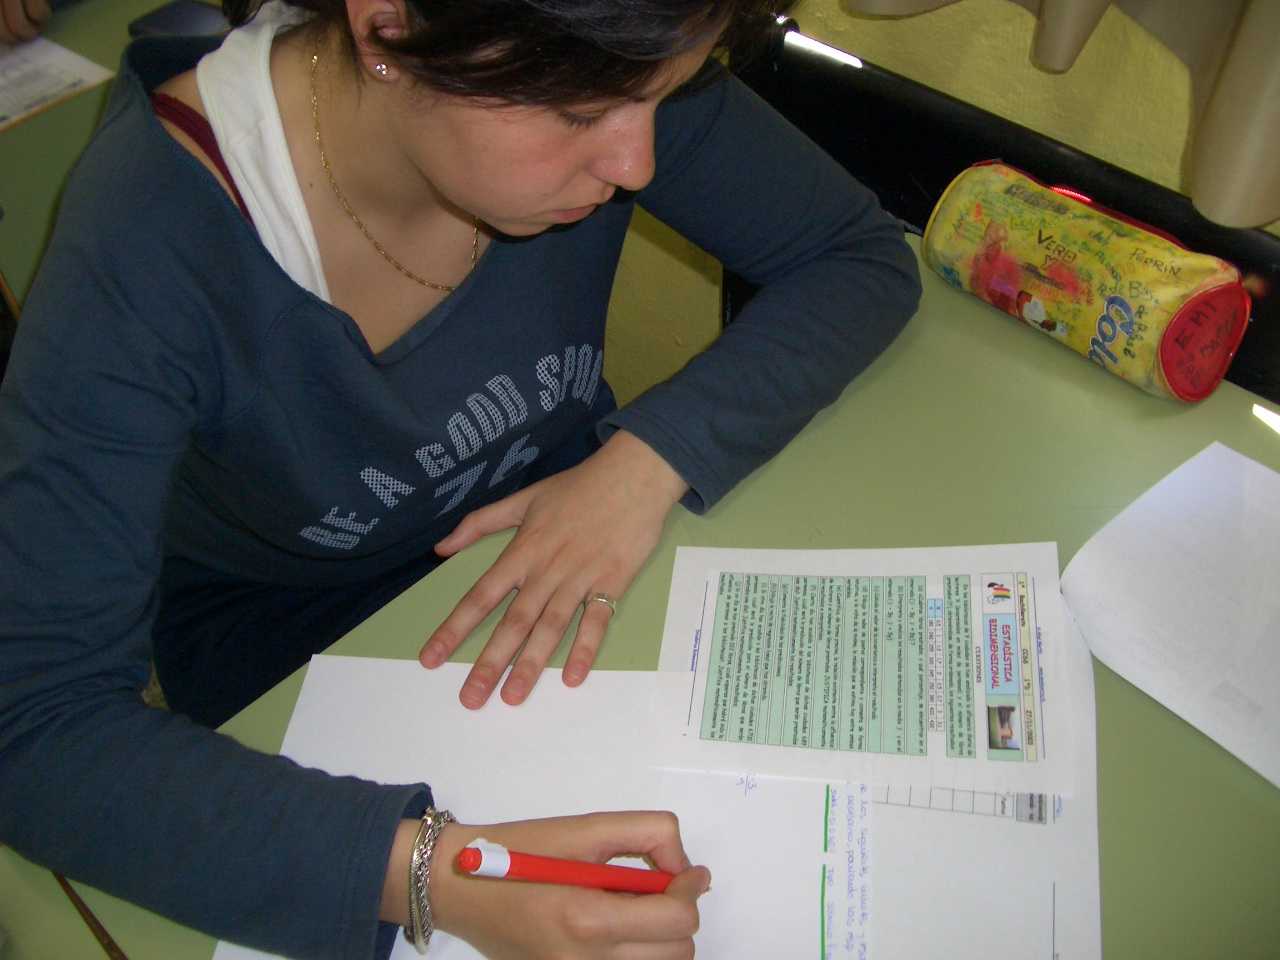
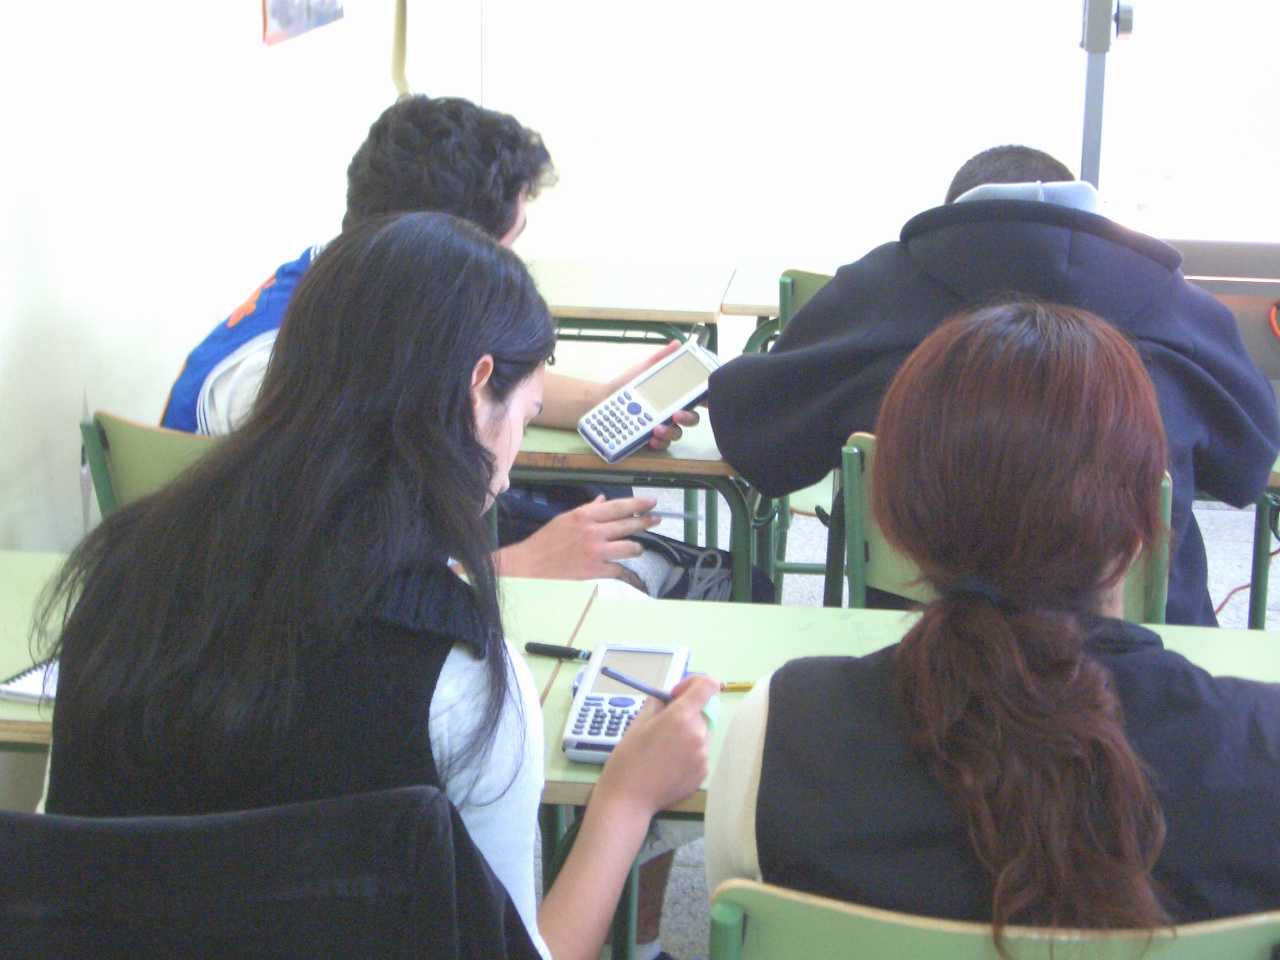
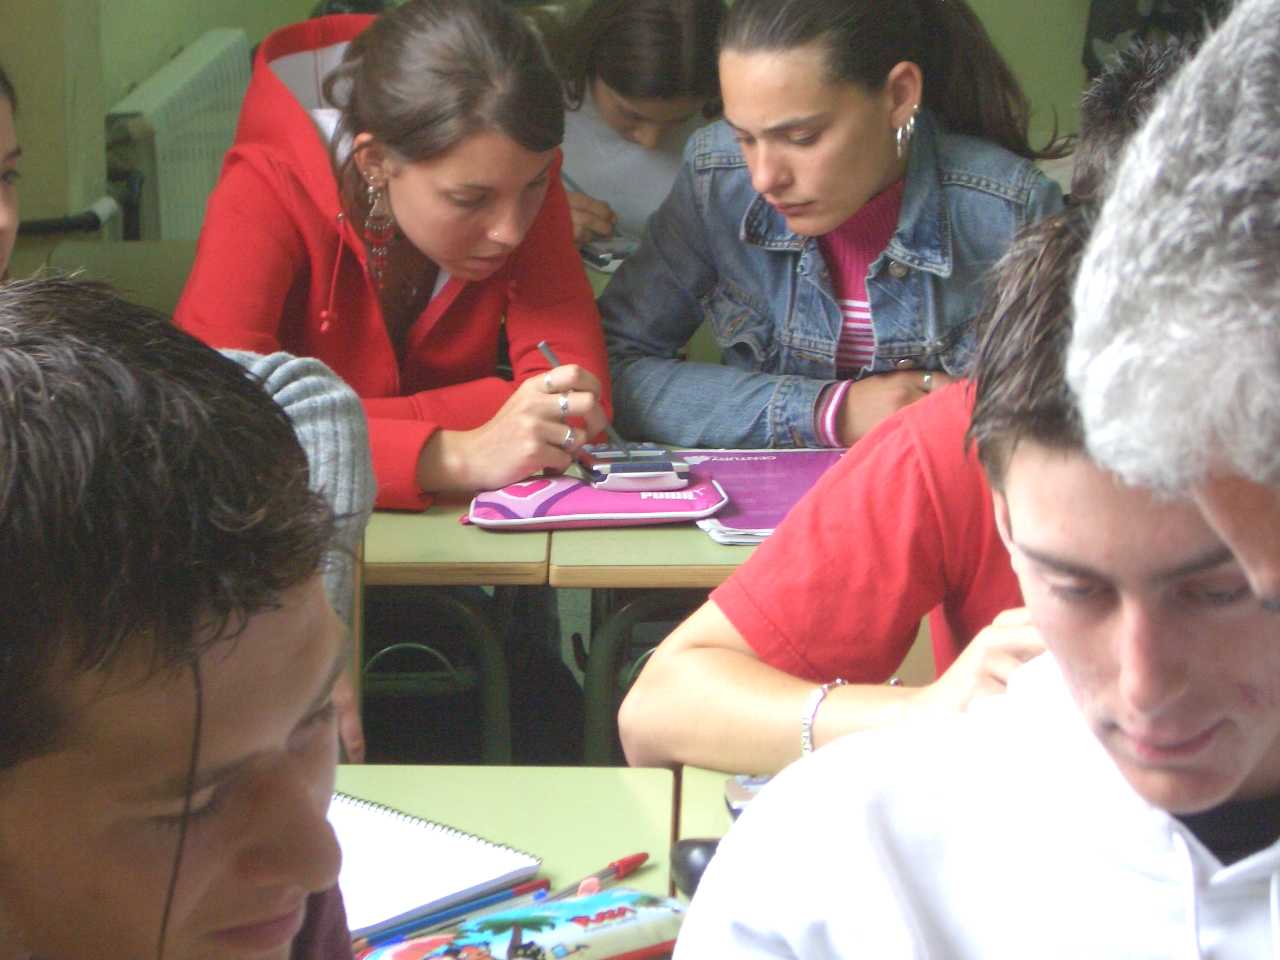
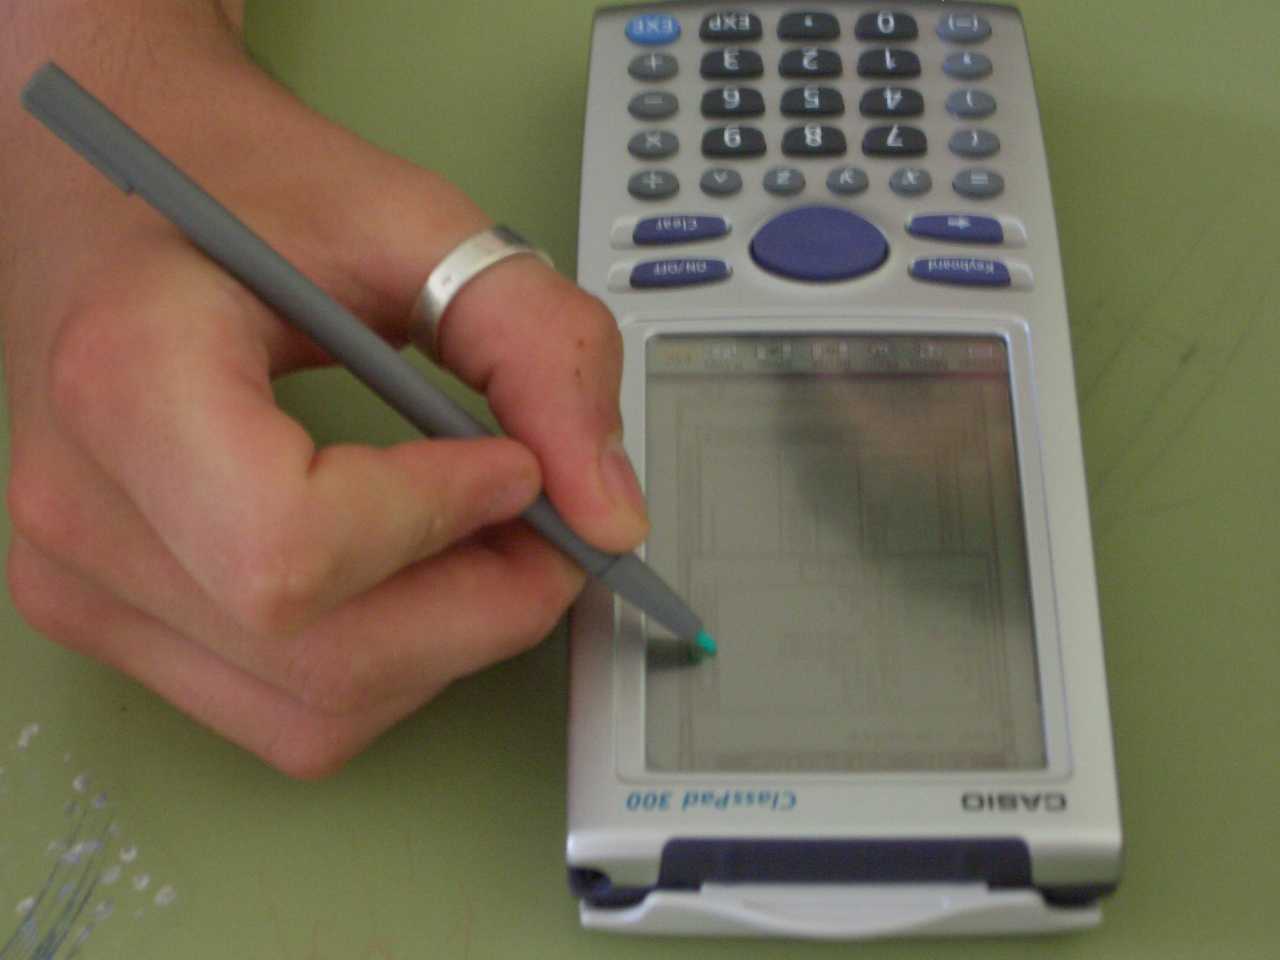
(c) Students are to be seated in pairs and use a latest-generation, hand-held graphing calculator (either their own or those supplied by the maths department) with the same features as the maths education tool used for overhead projection. Students use their calculator to analyse their hypotheses, look for alternatives to the methods presented by the teacher, confirm projections and results, graphically represent problems to better visualise concepts, etc., while also becoming familiar with and learning to use Windows-based statistics software in the classroom.
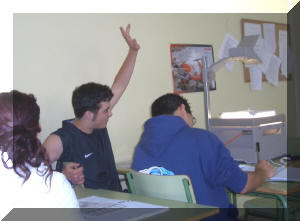
One of the students works on the calculator while the other makes suggestions. This encourages respectful, organised team work. The students periodically switch roles.
|
|
|
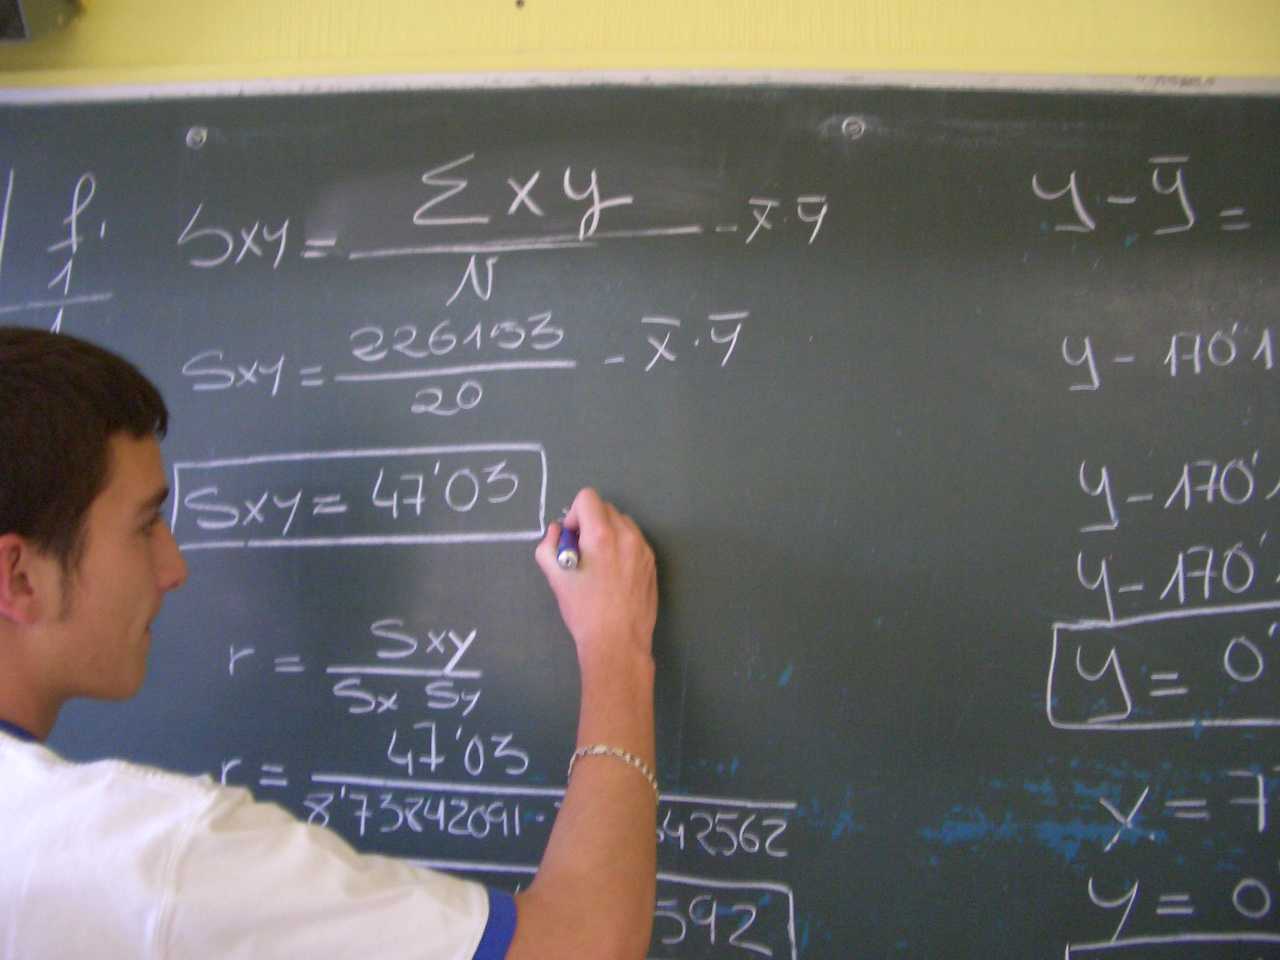
(d) The teacher presents the subject in a constructive manner, encouraging student participation and providing details about the content (covariance, correlation coefficient, regression lines, etc.). For lower level classes, the mathematical calculations are not described in depth, whereas the appropriate mathematical justifications are given for each of the concepts for higher level classes.
|
|
|
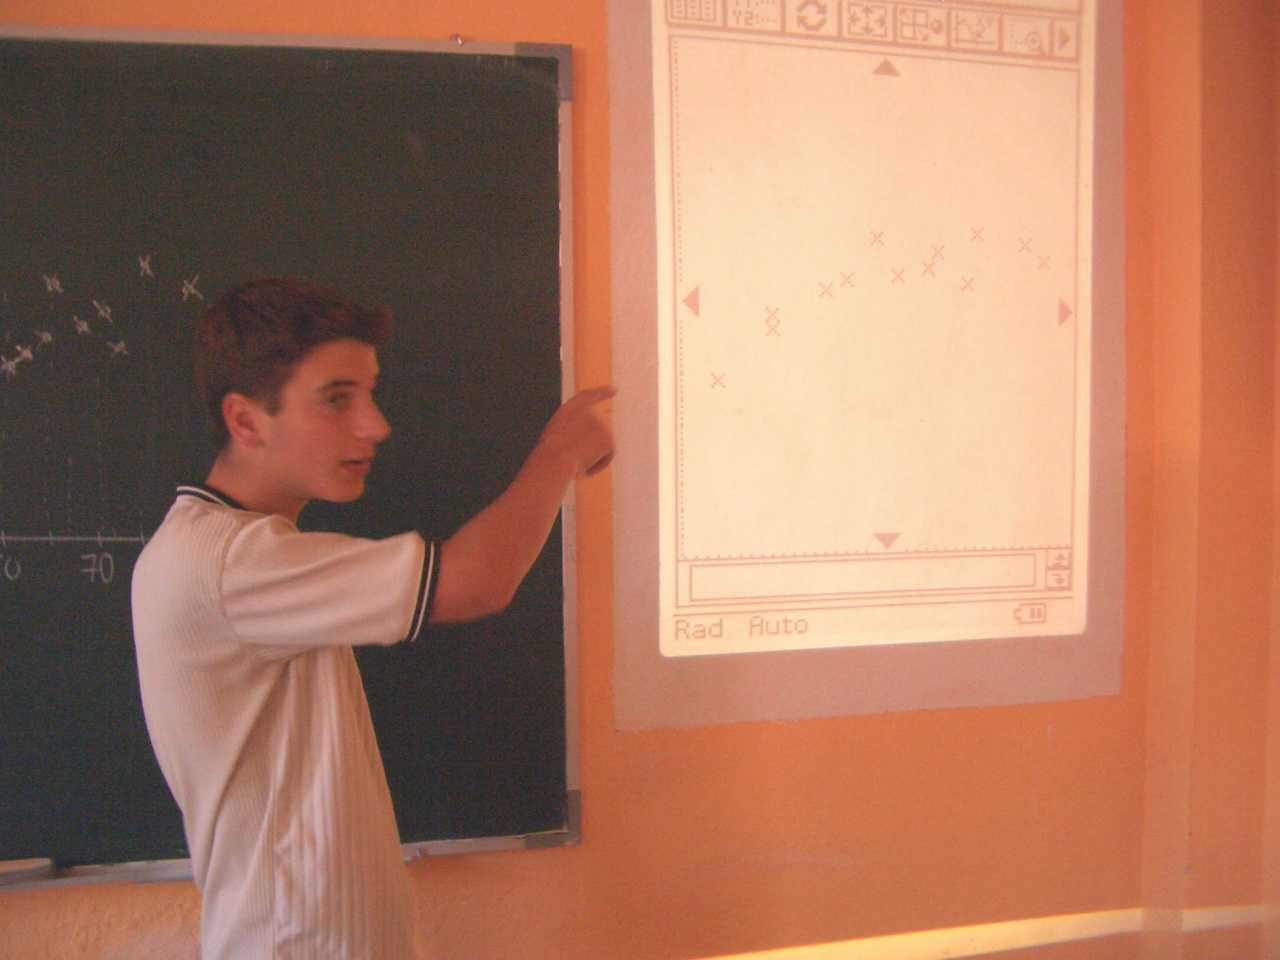
(e) Students first plan how to obtain the data, which they represent numerically using frequency tables and graphically using scatter diagrams. Next students intuitively interpret the relationship between the variables for each case and then determine whether there is a linear relationship between them, whether the relationship is direct or inverse and whether it is possible to interpolate or extrapolate a specific result using the information provided by the scatter diagram. (Problem 2)
(f) Upon analysing the scatter diagrams obtained, the teacher introduces the concepts of correlation and correlation coefficients as a measurement of the degree of the linear relationship between the variables. Students are to interpret the meaning of the various values and correlation coefficient signs and determine the type of relationship between the variables under the given circumstances. (Problems 3 and 4).
(g) Given the various scatter diagrams, situations and correlation coefficients, students are asked to correctly assign each of them. They confirm their results by using the calculator to work out problems the teacher has previously entered. (Problem 5).
(h) Students use graphs to search for lines which conform to the two-dimensional distributions and find the relationship between the measurements of the two variables and the most suitable line. The teacher uses this intuitive learning process to introduce the concept of regression lines. It is also important for students to make extrapolations using regression lines, estimating the possible margins of error and the degree of reliability of their predictions. (Problem 6)
(i) Where outliers are present, it is possible to determine the importance of the Tukey line and to show that it is easy to study using a graphing calculator. It is unfeasible to study it using a pencil and paper, which would literally take hours. (Problem 7).
(j) This tool makes it possible to adjust the data to any linear or non-linear function, estimating the parameters of an optimisation criterion (the sum of least squares), thus making it a modelling tool which can be used in all sorts of fields (finances, marketing, medicine, etc.). (Problem 8)
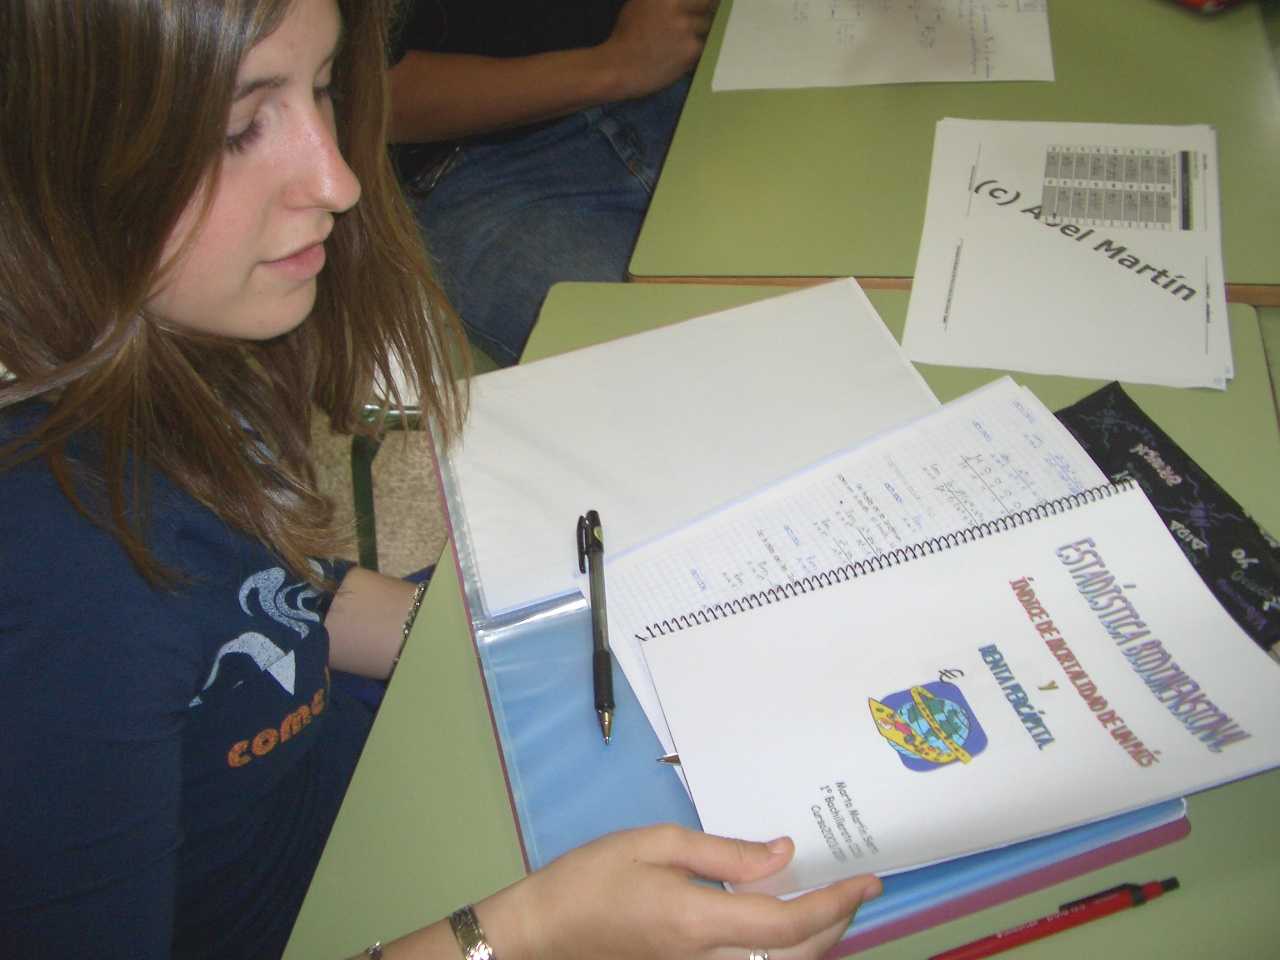
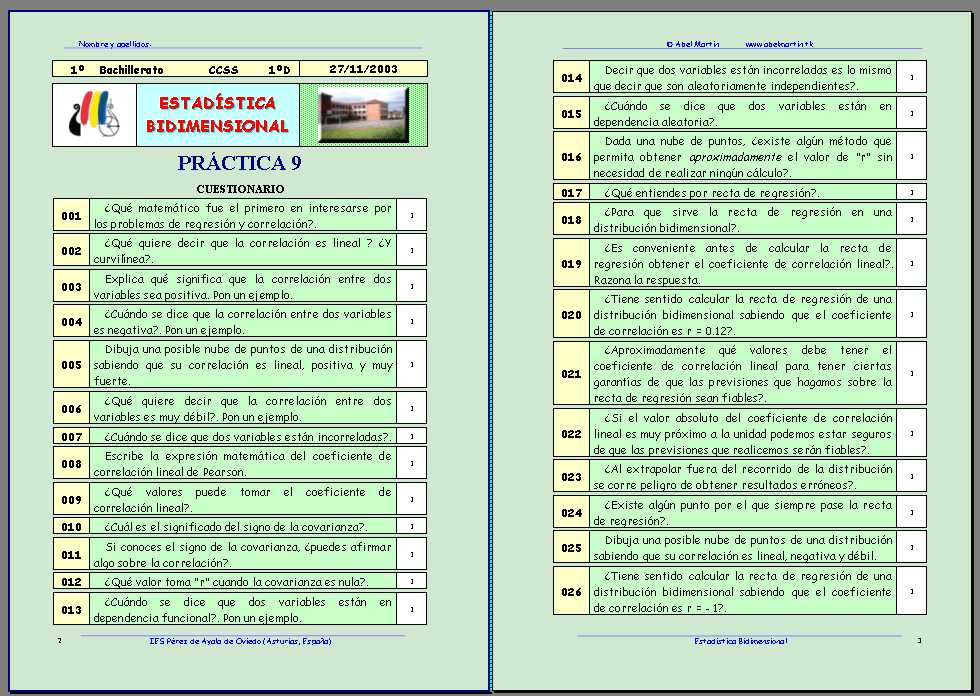
(k) Once the theoretical and practical aspects of the topic have been presented, students are given a set of problems calling for short answers. The aim is to verify their comprehension of the concepts taught. Students are to work on the problems individually as homework. They record their answers in a notebook and then share and discuss them with the class while the teacher acts as a moderator, encouraging debate and reflection. (Problem 9)

(l) ) Finally, we prepared 3 types of CONSOLIDATION ACTIVITIES:
![]() Type
A ACTIVITIES (16-17 years), in which students can use their calculator as an aid
for making operations and checking and comparing their results and hypotheses.
Students are to justify their operations with mathematical
calculations at all times.
Type
A ACTIVITIES (16-17 years), in which students can use their calculator as an aid
for making operations and checking and comparing their results and hypotheses.
Students are to justify their operations with mathematical
calculations at all times.
![]() Type
B ACTIVITIES (15-16 years), in which the calculator is given primary importance
and which consist of questions designed for students to enter data into the
calculator and then focus on the answers, reflecting on them. The main objective
is for students to UNDERSTAND the concepts and the
APPLICATION of the results to the situations
proposed.
Type
B ACTIVITIES (15-16 years), in which the calculator is given primary importance
and which consist of questions designed for students to enter data into the
calculator and then focus on the answers, reflecting on them. The main objective
is for students to UNDERSTAND the concepts and the
APPLICATION of the results to the situations
proposed.
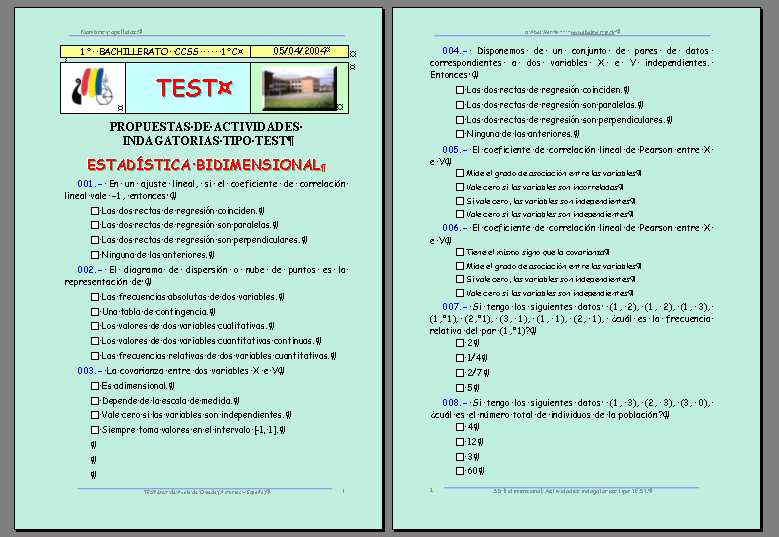
![]() MULTIPLE CHOICE ACTIVITIES. Students choose one of the answers provided.
MULTIPLE CHOICE ACTIVITIES. Students choose one of the answers provided.
|
|
|
![]() Below
is a series of model problems which can be used as exercises along the lines of
what we have described above. They are intended to give ideas to other teachers,
who are constantly faced with the challenge of bringing daily life into the
classroom.
Below
is a series of model problems which can be used as exercises along the lines of
what we have described above. They are intended to give ideas to other teachers,
who are constantly faced with the challenge of bringing daily life into the
classroom.
![]() Students choose a
topic to work on as an individual assignment with the aim of determining the
relationship between two variables. Once they have done the exercise, they write
up a thorough report including the conclusions drawn and an analysis. The
calculations should be simplified as much as possible by using instruments
commonly found in the classroom. The report should include a brief comment on
the topic chosen and citations of the reference books used, so as to broaden the
topic and the subject itself.
Students choose a
topic to work on as an individual assignment with the aim of determining the
relationship between two variables. Once they have done the exercise, they write
up a thorough report including the conclusions drawn and an analysis. The
calculations should be simplified as much as possible by using instruments
commonly found in the classroom. The report should include a brief comment on
the topic chosen and citations of the reference books used, so as to broaden the
topic and the subject itself.
|
|
|
![]()
|
|
|
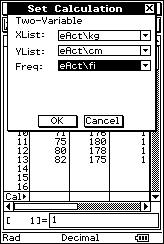
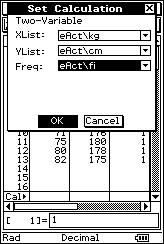
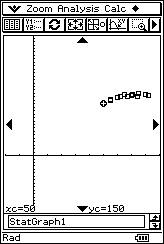
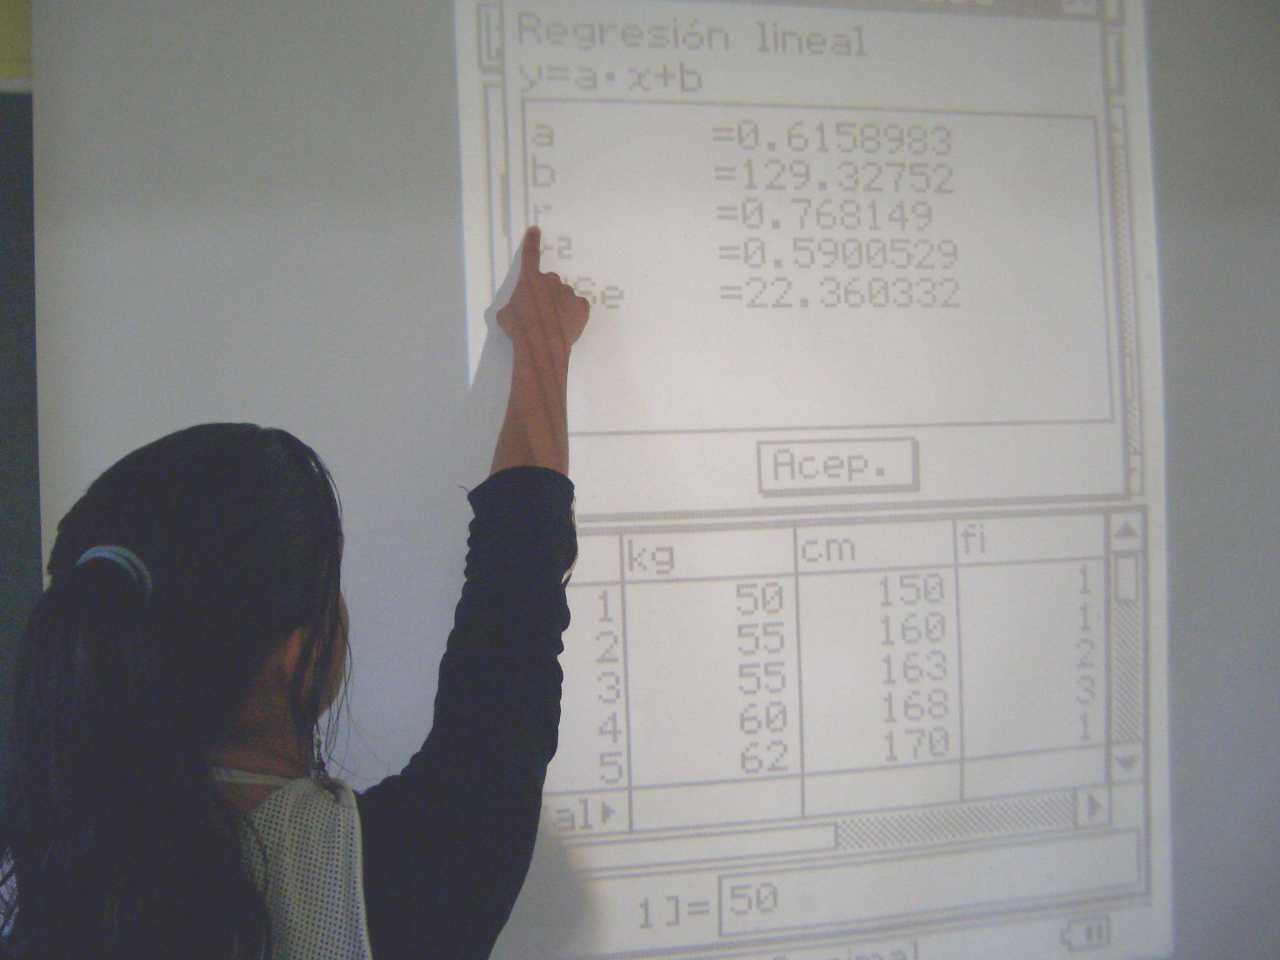
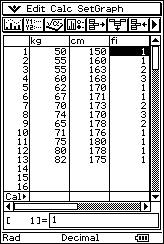
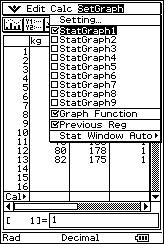
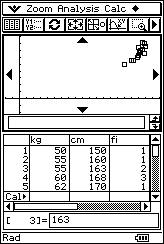
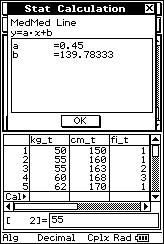
![]() The following is the weight ("x"
expressed in kg) and height ("y" expressed in cm) of 20 people:
The following is the weight ("x"
expressed in kg) and height ("y" expressed in cm) of 20 people:
(50, 150), (55, 160), (55, 163), (55, 163), (60, 168), (60, 168), (60, 168), (62, 170), (67, 171), (70, 173), (70, 173), (74, 170), (74, 170), (74, 170), (65, 178), (65, 178), (71, 176), (75, 180), (80, 178), (82, 175).
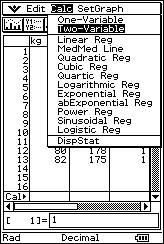
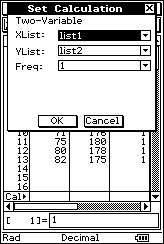
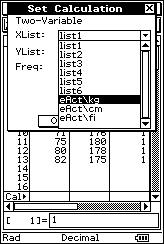
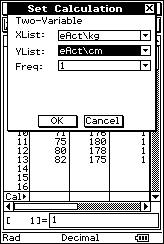
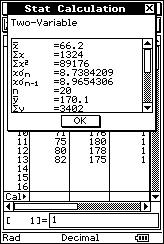
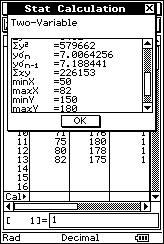
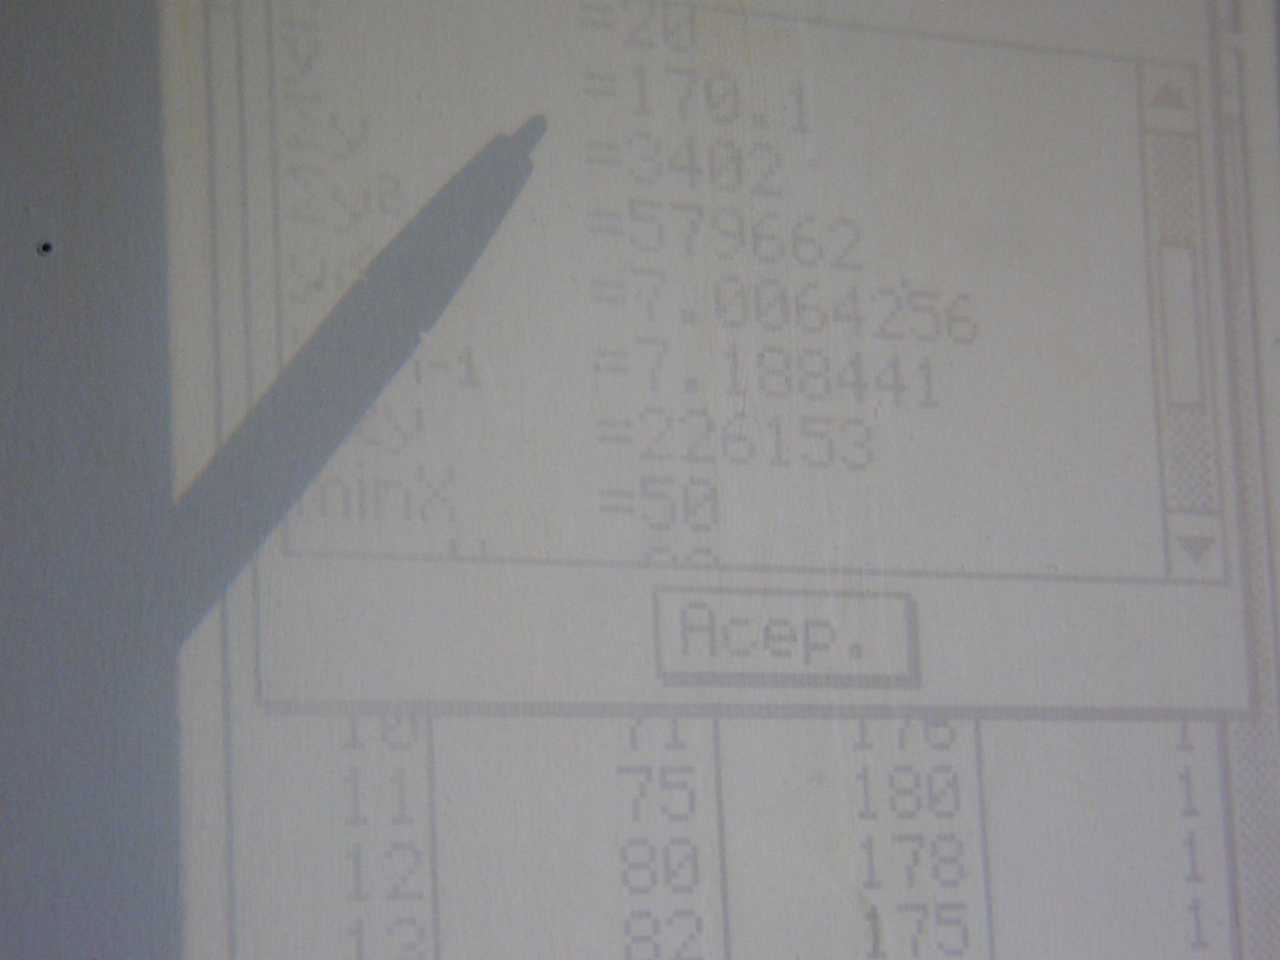
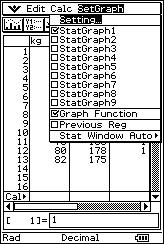
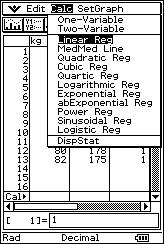
![]() Using
a calculator, find and interpret the value of the various one-dimensional
statistical parameters for the weights (W) and heights (H) of these people.
Using
a calculator, find and interpret the value of the various one-dimensional
statistical parameters for the weights (W) and heights (H) of these people.
|
|
|
|
|
|
|
|
|
|
|
|
|
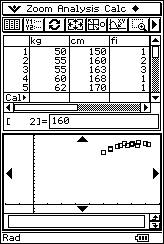
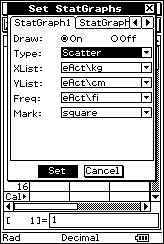
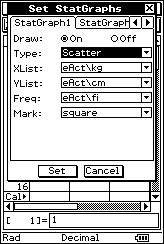
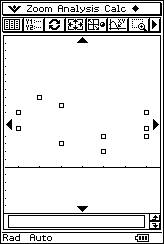
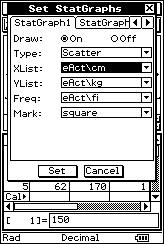
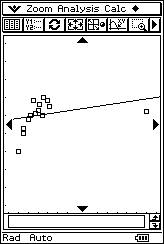
![]() Represent the pairs of values of the distribution as a system of Cartesian axes.
Represent the pairs of values of the distribution as a system of Cartesian axes.
 |
 |
 |
 |
|
|
|
|
|
|
|
|
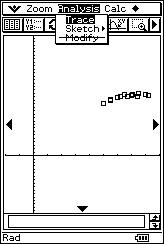
![]() Using
your intuition, determine the relationship between the variables.
Using
your intuition, determine the relationship between the variables.
|
|
|
![]()
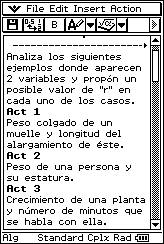
![]() Analyse the following examples
involving two variables and propose a possible "r" value for each case.
Analyse the following examples
involving two variables and propose a possible "r" value for each case.
![]() A
weight hanging on a spring and to what length the spring expands.
A
weight hanging on a spring and to what length the spring expands.
![]() A
person’s weight and height.
A
person’s weight and height.
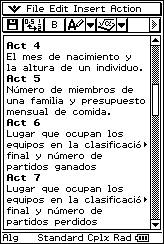
![]() The
month of birth and height of a person.
The
month of birth and height of a person.
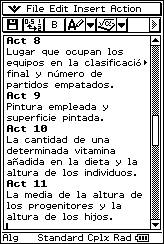
![]() The
ranking of the teams who have made the finals and the number of matches they
have won.
The
ranking of the teams who have made the finals and the number of matches they
have won.
![]() The
ranking of the teams who have made the finals and the number of matches they
have lost.
The
ranking of the teams who have made the finals and the number of matches they
have lost.
![]() The
ranking of the teams who have made the finals and the number of tied matches.
The
ranking of the teams who have made the finals and the number of tied matches.
 |
 |
 |
 |
 |
 |
 |
![]()
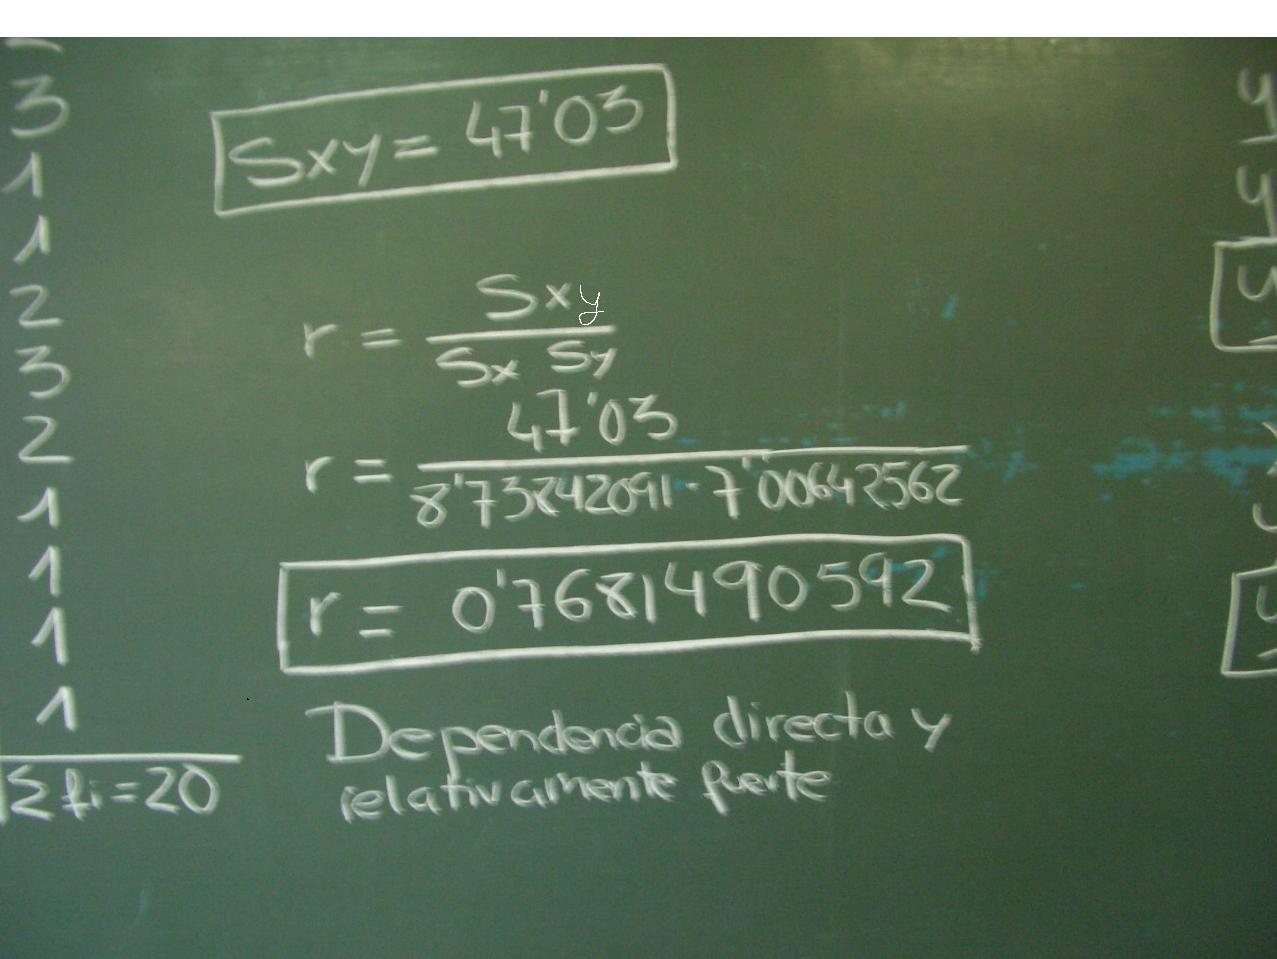
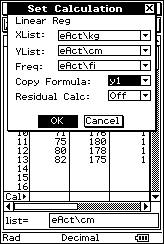
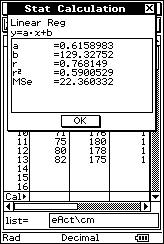
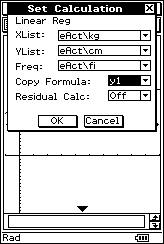
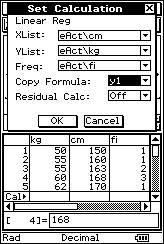
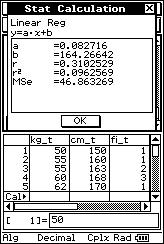
![]() Objectively, precisely and mathematically calculate the linear relationship
between the weights ("x" kg) and heights ("y" cm).
Objectively, precisely and mathematically calculate the linear relationship
between the weights ("x" kg) and heights ("y" cm).
![]() What
is the parameter used to measure this called?
What
is the parameter used to measure this called?
|
|
 |
 |
 |
|
|
|
![]()
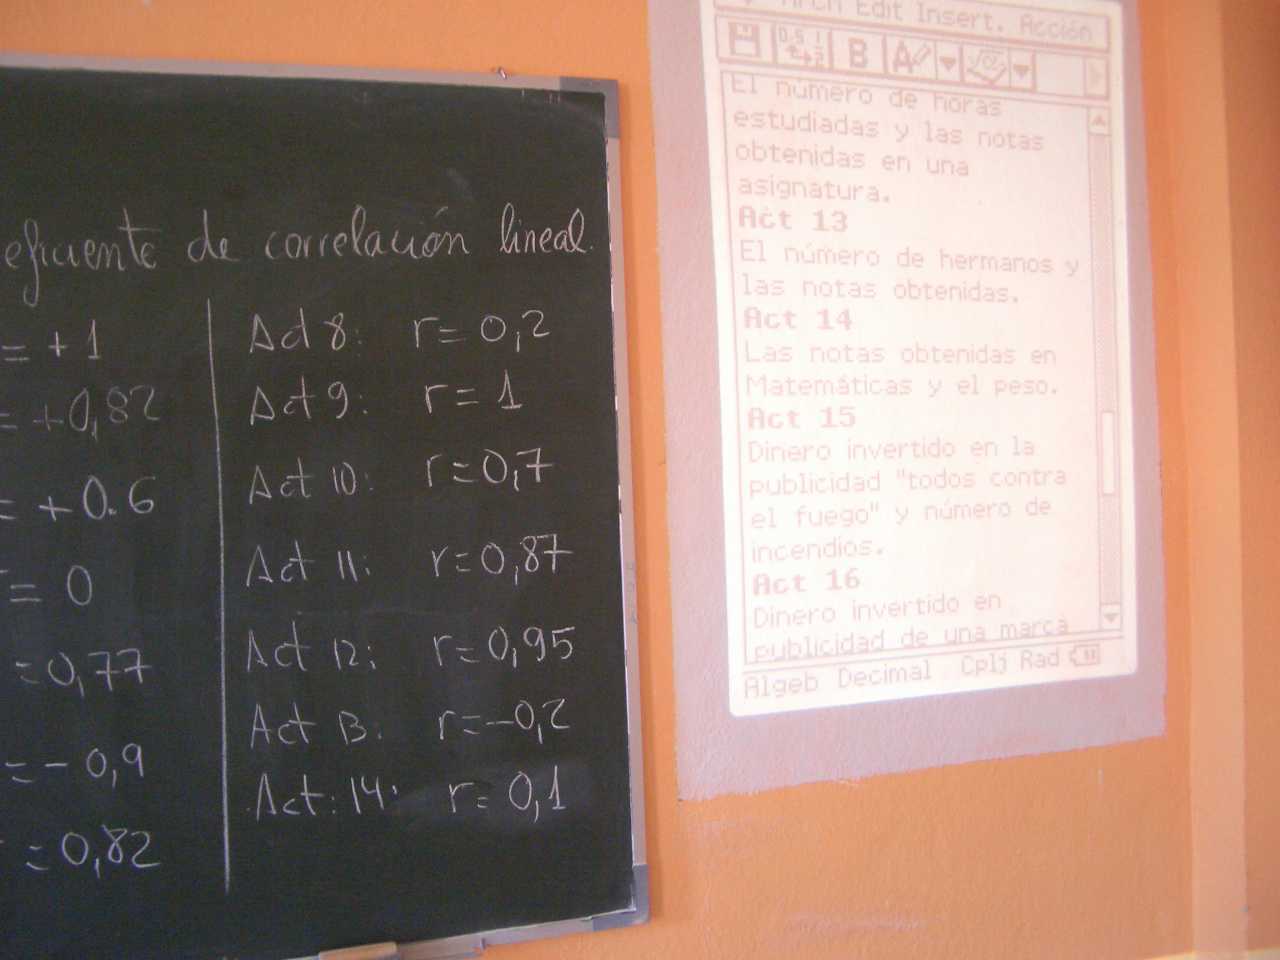
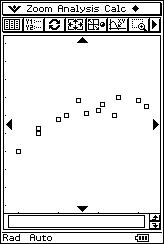
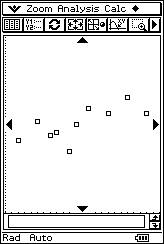
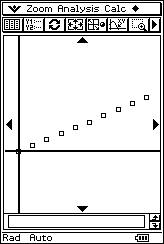
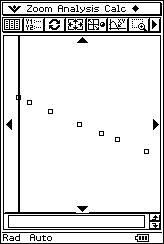
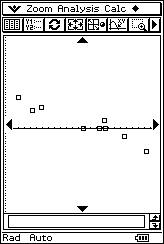
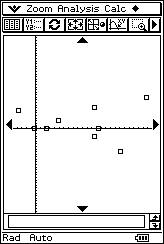
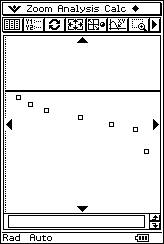
![]() Using the overhead projector
to display the calculator screen, the teacher proposes eight different scatter
diagrams and eight possible “r” values. The students determine the corresponding
linear correlation for each scatter diagram.
Using the overhead projector
to display the calculator screen, the teacher proposes eight different scatter
diagrams and eight possible “r” values. The students determine the corresponding
linear correlation for each scatter diagram.
 |
r = 0.76 r = 0.69 r = 1 r = - 0.99 |
r = - 0.33 r = - 0.95 r = 0.01 r = - 0.94 |
![]()
 |
 |
 |
 |
 |
 |
 |
 |
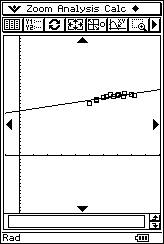
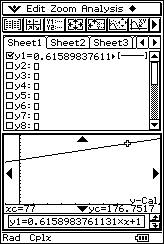
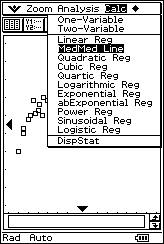
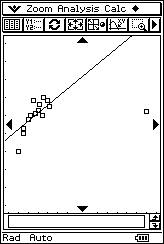
![]() Find
the equation of the line that best conforms to the scatter diagram. (Beginning
classes use a PENCIL AND PAPER and advanced classes use a calculator.)
Find
the equation of the line that best conforms to the scatter diagram. (Beginning
classes use a PENCIL AND PAPER and advanced classes use a calculator.)
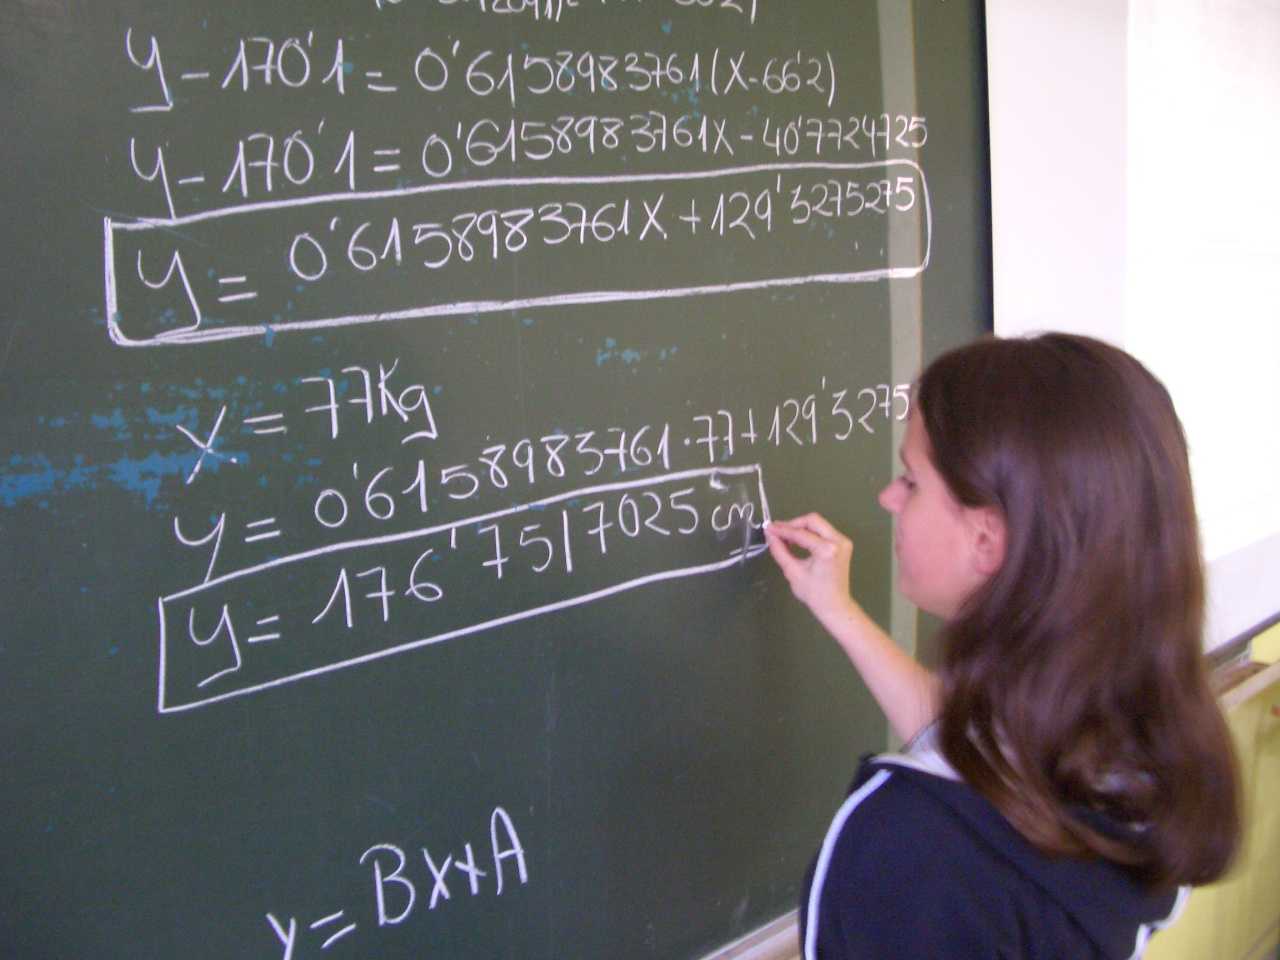
![]() How
tall would you expect a person weighing 77 kg to be? Justify your answer.
How
tall would you expect a person weighing 77 kg to be? Justify your answer.
![]() Comment on the reliability of your predictions.
Comment on the reliability of your predictions.
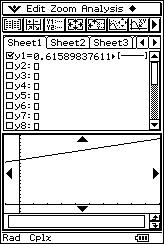
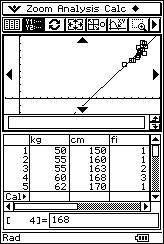
![]() Draw
the regression line for "y" over "x" on the scatter diagram to determine how it
matches it.
Draw
the regression line for "y" over "x" on the scatter diagram to determine how it
matches it.
 |
 |
 |
 |
 |
 |
 |
 |
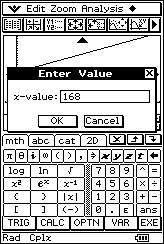
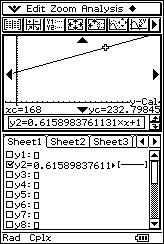
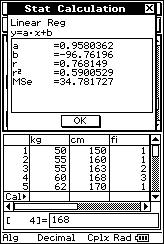
![]() How
tall would you expect a person weighing 168 kg to be?
How
tall would you expect a person weighing 168 kg to be?
 |
|
 |
 |
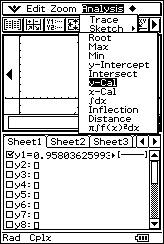
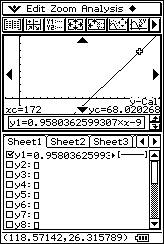
![]() Calculate the regression line for "x" over "y". Justify your answer.
Calculate the regression line for "x" over "y". Justify your answer.
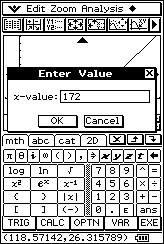
![]() How
much would you expect a person who is 172 cm tall to weigh?
How
much would you expect a person who is 172 cm tall to weigh?
 |
 |
 |
 |
 |
 |
 |
 |
![]()
![]() Let us now add one more
piece of data: (180, 172). Determine the new regression line. Briefly explain
your answer and how you have obtained it.
Let us now add one more
piece of data: (180, 172). Determine the new regression line. Briefly explain
your answer and how you have obtained it.
 |
 |
 |
 |
 |
![]()
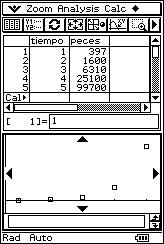
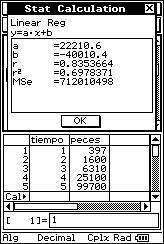
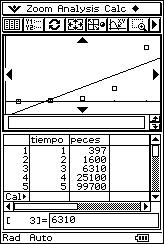
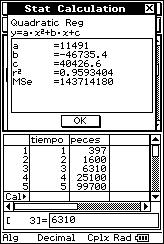
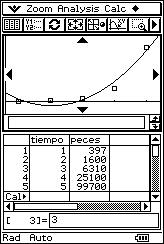
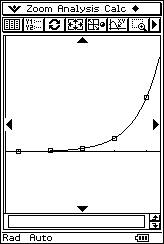
![]() 5
years ago a lake began to be repopulated with new species of fish. 100 fish of
this new species were introduced and have since been observed. The number of
fish at the end of each year was calculated using appropriate statistical
counting methods, the results of which are as follows:
5
years ago a lake began to be repopulated with new species of fish. 100 fish of
this new species were introduced and have since been observed. The number of
fish at the end of each year was calculated using appropriate statistical
counting methods, the results of which are as follows:
(1, 397), (2, 1600), (3, 6310), (4, 25100), (5, 99700).

![]() Determine whether there is a non-linear regression which matches the data better
than a linear regression.
Determine whether there is a non-linear regression which matches the data better
than a linear regression.
 |
 |
 |
 |
 |
 |
 |
 |
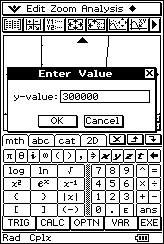
![]() How
long will it take for there to be 300,000 fish in the lake?
How
long will it take for there to be 300,000 fish in the lake?
|
|
|
![]() Considering the environmental factors (space, pollution, food, competition,
etc.) which affects population growth, is there a regression which would make
the prediction for population growth more reliable? What is it called?
Considering the environmental factors (space, pollution, food, competition,
etc.) which affects population growth, is there a regression which would make
the prediction for population growth more reliable? What is it called?
|
|
|
![]()
![]() Briefly answer the following questions and give reasons to justify your answer:
Briefly answer the following questions and give reasons to justify your answer:
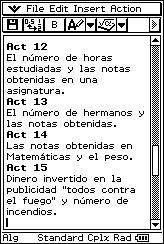
![]() The
linear correlation between two variables is positive. What does this mean? Give
an example.
The
linear correlation between two variables is positive. What does this mean? Give
an example.
![]() Is
there a point which the regression line always intersects?
Is
there a point which the regression line always intersects?
![]() The
linear correlation between two variables is very weak. What does this mean? Give
an example.
The
linear correlation between two variables is very weak. What does this mean? Give
an example.
![]() Does
it make sense to calculate the regression line of a two-dimensional distribution
if you know that the correlation co-efficient is r = 0.12?
Does
it make sense to calculate the regression line of a two-dimensional distribution
if you know that the correlation co-efficient is r = 0.12?
![]() Given
a scatter diagram, is there a method you can use to obtain an approximate value
for “r” without having to make any calculations?
Given
a scatter diagram, is there a method you can use to obtain an approximate value
for “r” without having to make any calculations?
![]() The
correlation is only valid for values which are close to the data. Why?
The
correlation is only valid for values which are close to the data. Why?
Note: there are a total of 26 questions.
|
|
|
![]()
![]() A
project.
A
project.
![]() An
objective, written test (varying according to class level) comprised of both
questions whose answers must be mathematically reasoned and multiple choice
questions.
An
objective, written test (varying according to class level) comprised of both
questions whose answers must be mathematically reasoned and multiple choice
questions.
|
|
|
Using these new, state-of-the-art maths education tools adds to the learning process. They have proven to be very useful in the search for alternative methods to traditional teaching techniques and have shown better academic results compared to those of the students in the “control group”, in which such tools were not used at all. Students were notably more eager about the course, which, thanks to the use of these tools, was more in line with the reality they are surrounded by. This was also reflected in the results of a survey conducted at the end of the course.
The time has come to break down the “impassable walls” posed by secondary education, not to mention primary education, which is a slave to algorithms and mechanical calculating and which, we, as teachers, have passed on from generation to generation... Let’s put ourselves in our students’ shoes and recall what we hated when we were in school! Remember thinking:
“What a nightmare... it’s time for maths!”
... let's change it
Great... , it's time for maths!!

the main objective ...
TO THINK !!
| Summary | Introduction | Contents | Objectives | Methodology | Problems | Evaluation | Final thoughts |
![]()